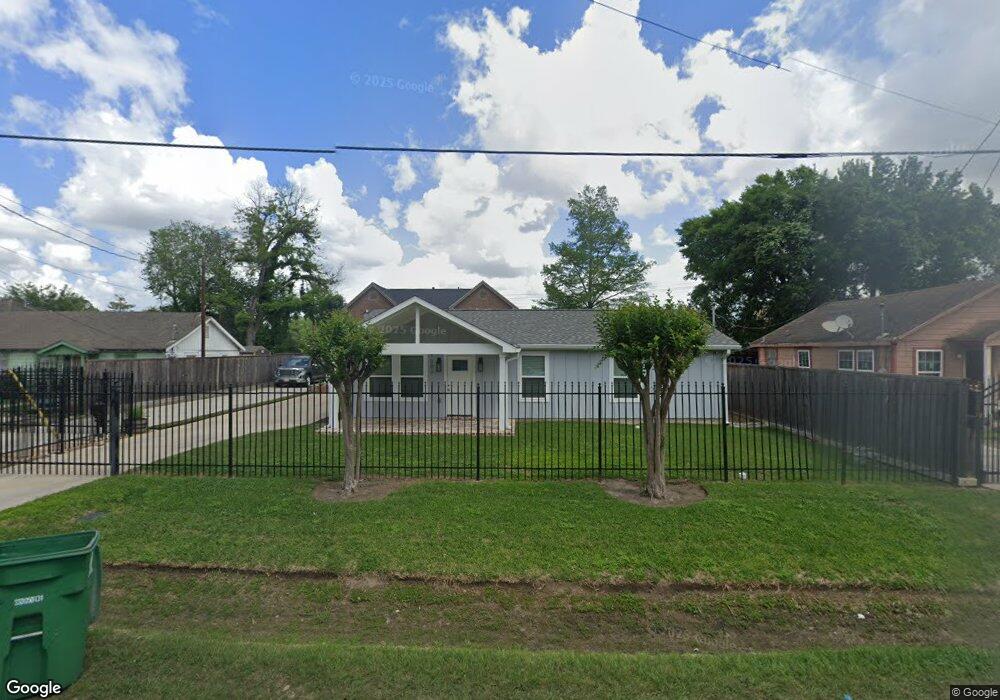
1303 Charnwood St Houston, TX 77022
Northside-Northline NeighborhoodEstimated Value: $207,775 - $258,000
3
Beds
2
Baths
1,271
Sq Ft
$190/Sq Ft
Est. Value
About This Home
This home is located at 1303 Charnwood St, Houston, TX 77022 and is currently estimated at $241,444, approximately $189 per square foot. 1303 Charnwood St is a home located in Harris County with nearby schools including Janowski Elementary School, Burbank Middle School, and Sam Houston Math, Science & Technology Center.
Ownership History
Date
Name
Owned For
Owner Type
Purchase Details
Closed on
Mar 27, 2021
Sold by
Delacruz Rudy and Delacruz Cathy R
Bought by
Delacruz Rudy and Delacruz Cathy R
Current Estimated Value
Purchase Details
Closed on
Aug 6, 2014
Sold by
Delacruz Randy
Bought by
Delacruz Rudy
Purchase Details
Closed on
Feb 7, 2006
Sold by
Delacruz Raul R and Delacruz Alicia S
Bought by
Delacruz Randy and Delacruz Rudy
Create a Home Valuation Report for This Property
The Home Valuation Report is an in-depth analysis detailing your home's value as well as a comparison with similar homes in the area
Home Values in the Area
Average Home Value in this Area
Purchase History
| Date | Buyer | Sale Price | Title Company |
|---|---|---|---|
| Delacruz Rudy | -- | Solidifi | |
| Delacruz Rudy | -- | None Available | |
| Delacruz Randy | -- | None Available |
Source: Public Records
Tax History Compared to Growth
Tax History
| Year | Tax Paid | Tax Assessment Tax Assessment Total Assessment is a certain percentage of the fair market value that is determined by local assessors to be the total taxable value of land and additions on the property. | Land | Improvement |
|---|---|---|---|---|
| 2025 | $4,436 | $227,688 | $81,411 | $146,277 |
| 2024 | $4,436 | $212,000 | $74,716 | $137,284 |
| 2023 | $4,436 | $222,969 | $45,526 | $177,443 |
| 2022 | $2,714 | $123,244 | $45,526 | $77,718 |
| 2021 | $2,380 | $102,121 | $45,526 | $56,595 |
| 2020 | $2,295 | $94,771 | $45,526 | $49,245 |
| 2019 | $2,299 | $90,857 | $37,492 | $53,365 |
| 2018 | $1,870 | $73,912 | $31,333 | $42,579 |
| 2017 | $1,869 | $73,912 | $31,333 | $42,579 |
| 2016 | $1,631 | $64,521 | $29,458 | $35,063 |
| 2015 | $1,410 | $54,852 | $21,424 | $33,428 |
| 2014 | $1,410 | $54,852 | $21,424 | $33,428 |
Source: Public Records
Map
Nearby Homes
- 8109 W Hardy Rd
- 1104 Charnwood St
- 1016 Apache St
- 743 Apache St
- 1207 Firnat St
- 714 Apache St
- 741 Mcdaniel St
- 8411 Berry Brush Ln
- 631 Apache St
- 8402 Berry Green Ln
- 802 Berry Sage Ln
- 723 Doverside St
- 8718 Brannon St
- 726 Mcdaniel St
- 1817 Mcdaniel St
- 729 Caperton St
- 2017 Sadler St
- 807 Firnat St
- 88 Berry Rd
- 8205 Appleton St
- 1303 Charnwood St
- 1225 Charnwood St
- 1307 Charnwood St
- 1311 Charnwood St
- 1313 Charnwood St
- 1221 Charnwood St
- 1236 Charnwood St
- 1317 Charnwood St
- 1302 Charnwood St
- 1304 Charnwood St
- 1224 Charnwood St
- 1321 Charnwood St
- 1314 Charnwood St
- 1228 Charnwood St
- 1220 Charnwood St
- 1108 Charnwood St
- 1323 Charnwood St
- 1210 Charnwood St Unit B
- 1225 Norham St
- 1318 Charnwood St