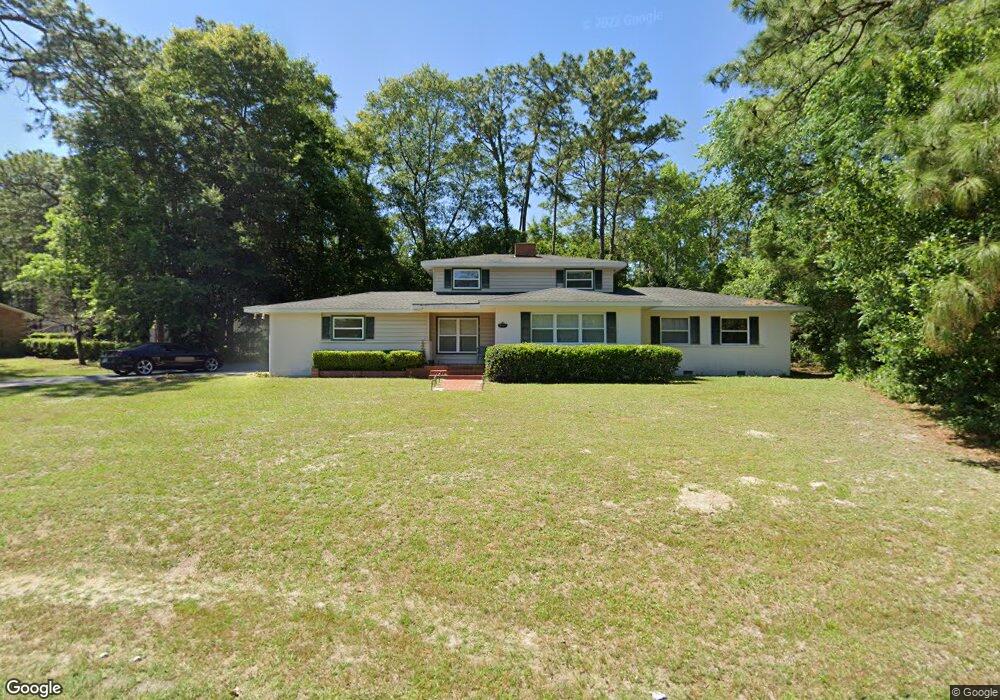
1303 Coral Rd Waycross, GA 31501
Estimated Value: $185,000 - $219,000
3
Beds
3
Baths
1,806
Sq Ft
$112/Sq Ft
Est. Value
About This Home
This home is located at 1303 Coral Rd, Waycross, GA 31501 and is currently estimated at $202,233, approximately $111 per square foot. 1303 Coral Rd is a home located in Ware County with nearby schools including Center Elementary School, Waycross Middle School, and Ware County High School.
Ownership History
Date
Name
Owned For
Owner Type
Purchase Details
Closed on
Jun 14, 2021
Sold by
Koochi Mohammad Ali Rashidi
Bought by
Pearson Linda F
Current Estimated Value
Home Financials for this Owner
Home Financials are based on the most recent Mortgage that was taken out on this home.
Original Mortgage
$114,978
Outstanding Balance
$104,098
Interest Rate
2.9%
Mortgage Type
FHA
Estimated Equity
$98,135
Purchase Details
Closed on
Jun 19, 2017
Bought by
Koochi Mohammad Ali Rashidi
Purchase Details
Closed on
Mar 7, 2017
Bought by
Sec Of Housing & Urban
Purchase Details
Closed on
Apr 28, 2014
Sold by
Dixon Harry D
Bought by
Regina Roath
Home Financials for this Owner
Home Financials are based on the most recent Mortgage that was taken out on this home.
Original Mortgage
$106,043
Interest Rate
4.5%
Mortgage Type
FHA
Create a Home Valuation Report for This Property
The Home Valuation Report is an in-depth analysis detailing your home's value as well as a comparison with similar homes in the area
Home Values in the Area
Average Home Value in this Area
Purchase History
| Date | Buyer | Sale Price | Title Company |
|---|---|---|---|
| Pearson Linda F | $117,100 | -- | |
| Koochi Mohammad Ali Rashidi | $57,650 | -- | |
| Sec Of Housing & Urban | $69,300 | -- | |
| Homebridge Financial Svcs Inc | $69,300 | -- | |
| Regina Roath | $108,000 | -- |
Source: Public Records
Mortgage History
| Date | Status | Borrower | Loan Amount |
|---|---|---|---|
| Open | Pearson Linda F | $114,978 | |
| Previous Owner | Regina Roath | $106,043 |
Source: Public Records
Tax History Compared to Growth
Tax History
| Year | Tax Paid | Tax Assessment Tax Assessment Total Assessment is a certain percentage of the fair market value that is determined by local assessors to be the total taxable value of land and additions on the property. | Land | Improvement |
|---|---|---|---|---|
| 2024 | $2,613 | $66,040 | $7,560 | $58,480 |
| 2023 | $2,277 | $57,063 | $4,408 | $52,655 |
| 2022 | $2,274 | $57,063 | $4,408 | $52,655 |
| 2021 | $1,803 | $41,688 | $4,408 | $37,280 |
| 2020 | $1,768 | $40,558 | $4,408 | $36,150 |
| 2019 | $1,443 | $32,650 | $4,408 | $28,242 |
| 2018 | $1,407 | $31,520 | $4,408 | $27,112 |
| 2017 | $1,352 | $31,520 | $4,408 | $27,112 |
| 2016 | $1,352 | $31,002 | $4,408 | $26,594 |
| 2015 | $1,361 | $31,001 | $4,408 | $26,594 |
| 2014 | $1,360 | $31,002 | $4,408 | $26,594 |
| 2013 | -- | $31,001 | $4,407 | $26,594 |
Source: Public Records
Map
Nearby Homes
- 00 Seminole Trail
- 1400 E Cherokee Dr
- 1621 Camellia Dr
- 1502 Seminole Trail
- 1100 Euclid Ave
- Lot 3 City Blvd
- 1002 Baltimore Ave
- 1009 Euclid Ave
- 1703 Rainbow Dr
- 1001 Coral Rd
- 1715 City Blvd
- 1204 Richmond Ave
- 1103 Kontz Ave
- 1504 Danora Dr
- 1205 Dean Dr
- 1011 Cherokee Cir
- 1002 Cherokee Cir
- 907 Euclid Ave
- 1206 Morningside Dr
- 1617 Moss Creek Rd
- 1400 Seminole Trail
- 1506 City Blvd
- 1301 Coral Rd
- 1306 Coral Rd
- 1308 Coral Rd
- 1512 City Blvd
- 1304 Coral Rd
- 1310 Coral Rd
- 1509 City Blvd
- 1401 Seminole Trail
- 1521 City Blvd
- 1302 Coral Rd
- 0 City Blvd & Atlantic
- 1211 Coral Rd
- 1312 Coral Rd
- 1303 Seminole Trail
- 1403 Seminole Trail
- 1405 Seminole Trail
- 1506 Saint Catherine Dr
- 1508 Saint Catherine Dr