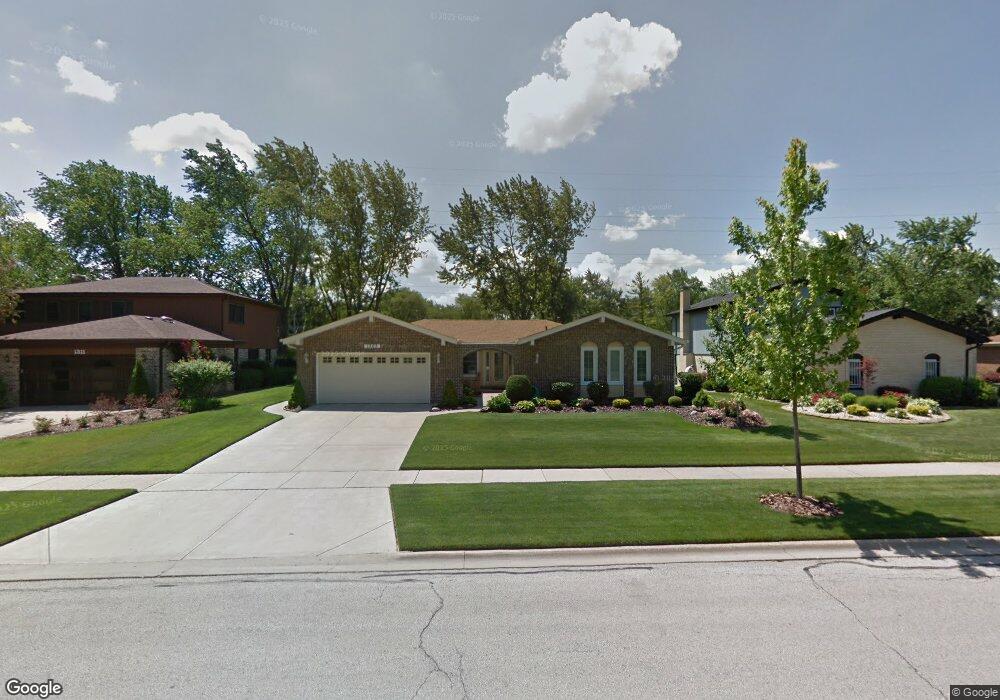
1303 E Carpenter Dr Palatine, IL 60074
Virginia Lake NeighborhoodEstimated Value: $508,000 - $564,000
3
Beds
2
Baths
2,360
Sq Ft
$228/Sq Ft
Est. Value
About This Home
This home is located at 1303 E Carpenter Dr, Palatine, IL 60074 and is currently estimated at $537,049, approximately $227 per square foot. 1303 E Carpenter Dr is a home located in Cook County with nearby schools including Jane Addams Elementary School, Palatine High School, and St Thomas Of Villanova School.
Ownership History
Date
Name
Owned For
Owner Type
Purchase Details
Closed on
Jan 9, 2007
Sold by
Katona Carol J
Bought by
Nudo Joseph and Nudo Ann
Current Estimated Value
Home Financials for this Owner
Home Financials are based on the most recent Mortgage that was taken out on this home.
Original Mortgage
$135,000
Outstanding Balance
$79,214
Interest Rate
6.16%
Mortgage Type
Unknown
Estimated Equity
$457,835
Purchase Details
Closed on
Jan 5, 2007
Sold by
Nudo Joseph and Nudo Anna
Bought by
Nudo Joseph and Nudo Anna
Home Financials for this Owner
Home Financials are based on the most recent Mortgage that was taken out on this home.
Original Mortgage
$135,000
Outstanding Balance
$79,214
Interest Rate
6.16%
Mortgage Type
Unknown
Estimated Equity
$457,835
Purchase Details
Closed on
Apr 22, 2003
Sold by
Mikosz John P
Bought by
Mikosz John P and John P Mikosz Trust
Create a Home Valuation Report for This Property
The Home Valuation Report is an in-depth analysis detailing your home's value as well as a comparison with similar homes in the area
Home Values in the Area
Average Home Value in this Area
Purchase History
| Date | Buyer | Sale Price | Title Company |
|---|---|---|---|
| Nudo Joseph | $435,000 | None Available | |
| Nudo Joseph | -- | None Available | |
| Mikosz John P | -- | -- | |
| Mikosz John P | -- | -- |
Source: Public Records
Mortgage History
| Date | Status | Borrower | Loan Amount |
|---|---|---|---|
| Open | Nudo Joseph | $135,000 |
Source: Public Records
Tax History
| Year | Tax Paid | Tax Assessment Tax Assessment Total Assessment is a certain percentage of the fair market value that is determined by local assessors to be the total taxable value of land and additions on the property. | Land | Improvement |
|---|---|---|---|---|
| 2025 | $9,483 | $52,000 | $7,200 | $44,800 |
| 2024 | $9,483 | $38,000 | $6,075 | $31,925 |
| 2023 | $9,120 | $38,000 | $6,075 | $31,925 |
| 2022 | $9,120 | $38,000 | $6,075 | $31,925 |
| 2021 | $8,647 | $32,620 | $5,625 | $26,995 |
| 2020 | $8,649 | $32,620 | $5,625 | $26,995 |
| 2019 | $8,682 | $36,447 | $5,625 | $30,822 |
| 2018 | $9,140 | $35,595 | $5,175 | $30,420 |
| 2017 | $9,000 | $35,595 | $5,175 | $30,420 |
| 2016 | $8,879 | $35,595 | $5,175 | $30,420 |
| 2015 | $8,046 | $30,685 | $4,725 | $25,960 |
| 2014 | $9,555 | $35,885 | $4,725 | $31,160 |
| 2013 | $9,280 | $35,885 | $4,725 | $31,160 |
Source: Public Records
Map
Nearby Homes
- 820 N Sanborn Dr
- 1239 E Carpenter Dr
- 1345 E Evergreen Dr Unit 3
- 1316 E Evergreen Dr Unit 7
- 1117 E Pratt Dr
- 673 N Newkirk Ln
- 1129 N Claremont Dr Unit 1627
- 1150 E Randville Dr Unit 1N
- 855 E Patten Dr
- 1000 Bayside Dr Unit 207
- 1426 E Ports o Call Dr
- 1313 N Baldwin Ct Unit 2C
- 1132 E Randville Dr Unit 2H
- 1100 E Randville Dr Unit 312
- 2500 Bayside Dr Unit 3
- 3000 Bayside Dr Unit 202
- 1351 N Winslowe Dr Unit 302
- 3500 Bayside Dr Unit 1
- 2609 N Greenwood Ave
- 915 N Saratoga Dr
- 1261 E Carpenter Dr
- 1311 E Carpenter Dr
- 1255 E Carpenter Dr
- 1319 E Carpenter Dr
- 1300 E Carpenter Dr
- 1308 E Carpenter Dr
- 843 N Virginia Lake Ct
- 1247 E Carpenter Dr
- 1333 E Carpenter Dr
- 1316 E Carpenter Dr
- 1324 E Carpenter Dr
- 1302 E Thurston Dr
- 1337 E Carpenter Dr
- 1258 E Thurston Dr
- 1308 E Thurston Dr
- 855 N Virginia Lake Ct
- 842 N Virginia Lake Ct
- 1252 E Thurston Dr
- 1328 E Carpenter Dr
- 850 N Virginia Lake Ct
Your Personal Tour Guide
Ask me questions while you tour the home.