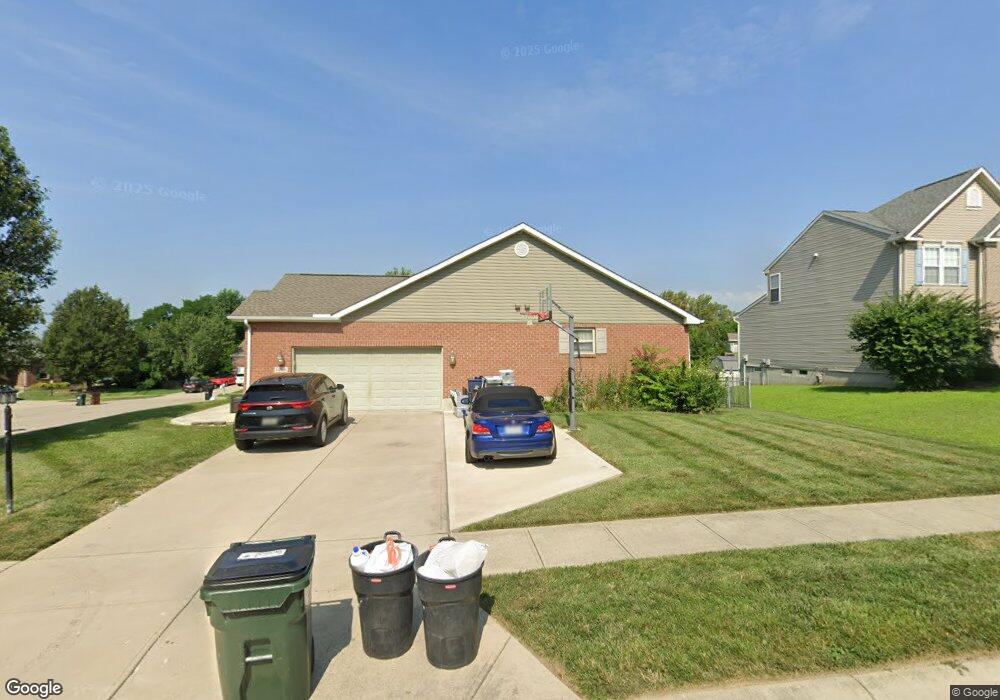
1303 Emily Beth Dr Miamisburg, OH 45342
Downtown Miamisburg NeighborhoodEstimated Value: $383,270 - $415,000
4
Beds
3
Baths
2,736
Sq Ft
$147/Sq Ft
Est. Value
About This Home
This home is located at 1303 Emily Beth Dr, Miamisburg, OH 45342 and is currently estimated at $403,318, approximately $147 per square foot. 1303 Emily Beth Dr is a home located in Montgomery County with nearby schools including Miamisburg High School.
Ownership History
Date
Name
Owned For
Owner Type
Purchase Details
Closed on
Mar 2, 2011
Sold by
Federal Home Loan Mortgage Corporation
Bought by
Yaney Alexander P and Yaney Amy C
Current Estimated Value
Home Financials for this Owner
Home Financials are based on the most recent Mortgage that was taken out on this home.
Original Mortgage
$187,417
Interest Rate
4.77%
Mortgage Type
FHA
Purchase Details
Closed on
Dec 23, 2010
Sold by
Flint Alice Mae and Flint Brownie
Bought by
Federal Home Loan Mortgage Corp
Purchase Details
Closed on
Mar 20, 2006
Sold by
Flint Brownie and Flint Alice
Bought by
Flint Brownie Jerry and Flint Alice Mae
Home Financials for this Owner
Home Financials are based on the most recent Mortgage that was taken out on this home.
Original Mortgage
$162,400
Interest Rate
6.38%
Mortgage Type
Fannie Mae Freddie Mac
Purchase Details
Closed on
Mar 28, 2005
Sold by
Gueltig & Black Development Corp
Bought by
Bel Oak Realty Inc
Home Financials for this Owner
Home Financials are based on the most recent Mortgage that was taken out on this home.
Original Mortgage
$173,500
Interest Rate
5.71%
Mortgage Type
Purchase Money Mortgage
Create a Home Valuation Report for This Property
The Home Valuation Report is an in-depth analysis detailing your home's value as well as a comparison with similar homes in the area
Home Values in the Area
Average Home Value in this Area
Purchase History
| Date | Buyer | Sale Price | Title Company |
|---|---|---|---|
| Yaney Alexander P | $157,500 | Attorney | |
| Federal Home Loan Mortgage Corp | $140,000 | None Available | |
| Flint Brownie Jerry | -- | None Available | |
| Flint Brownie | $239,900 | None Available | |
| Bel Oak Realty Inc | $37,000 | Title Pointe Agency |
Source: Public Records
Mortgage History
| Date | Status | Borrower | Loan Amount |
|---|---|---|---|
| Previous Owner | Yaney Alexander P | $187,417 | |
| Previous Owner | Flint Brownie | $162,400 | |
| Previous Owner | Bel Oak Realty Inc | $173,500 |
Source: Public Records
Tax History Compared to Growth
Tax History
| Year | Tax Paid | Tax Assessment Tax Assessment Total Assessment is a certain percentage of the fair market value that is determined by local assessors to be the total taxable value of land and additions on the property. | Land | Improvement |
|---|---|---|---|---|
| 2024 | $6,872 | $108,960 | $17,640 | $91,320 |
| 2023 | $6,872 | $108,440 | $17,640 | $90,800 |
| 2022 | $6,471 | $86,060 | $14,000 | $72,060 |
| 2021 | $5,721 | $86,060 | $14,000 | $72,060 |
| 2020 | $5,708 | $86,060 | $14,000 | $72,060 |
| 2019 | $4,987 | $68,950 | $14,000 | $54,950 |
| 2018 | $5,003 | $68,950 | $14,000 | $54,950 |
| 2017 | $4,948 | $68,950 | $14,000 | $54,950 |
| 2016 | $4,978 | $66,870 | $14,000 | $52,870 |
| 2015 | $4,880 | $66,870 | $14,000 | $52,870 |
| 2014 | $4,880 | $66,870 | $14,000 | $52,870 |
| 2012 | -- | $69,290 | $14,000 | $55,290 |
Source: Public Records
Map
Nearby Homes
- Hudson Plan at Deer Valley
- Alberti Ranch Plan at Deer Valley
- Allegheny Plan at Deer Valley
- Bramante Ranch Plan at Deer Valley
- 1265 Deer Valley Dr
- 1126 Terrington Way
- 1230 Deer Valley Dr
- 5561 Benner Rd
- 1045 S Linden Ave
- 1132 Nouvelle Dr
- 00 Benner Rd
- 1734 Rosina Dr
- 1035 Woods View Ct
- 1013 S Heincke Rd
- 727 Harnam Ct
- 1331 Cherry Hill Dr
- 811 Moon Ct
- 902 Althea Dr
- 1808 Burnside Dr
- 807 Dunaway St
- 1295 Emily Beth Dr
- 1321 Shelley Ct
- 1306 Emily Beth Dr
- 1319 Emily Beth Dr
- 1287 Emily Beth Dr
- 1298 Emily Beth Dr
- 1313 Shelley Ct
- 1314 Emily Beth Dr
- 1324 Shana Ct
- 1290 Emily Beth Dr
- 1320 Shelley Ct
- 1322 Emily Beth Dr
- 1333 Emily Beth Dr
- 1238 Terrington Way
- 1282 Emily Beth Dr
- 1230 Terrington Way
- 1246 Terrington Way
- 1315 Shana Ct
- 1330 Emily Beth Dr
- 1352 Kelly Marie Ct