
Seller's Agent in 2025
Jody Dupont
Compass360 Realty, Inc.
(912) 288-2282
495 Total Sales
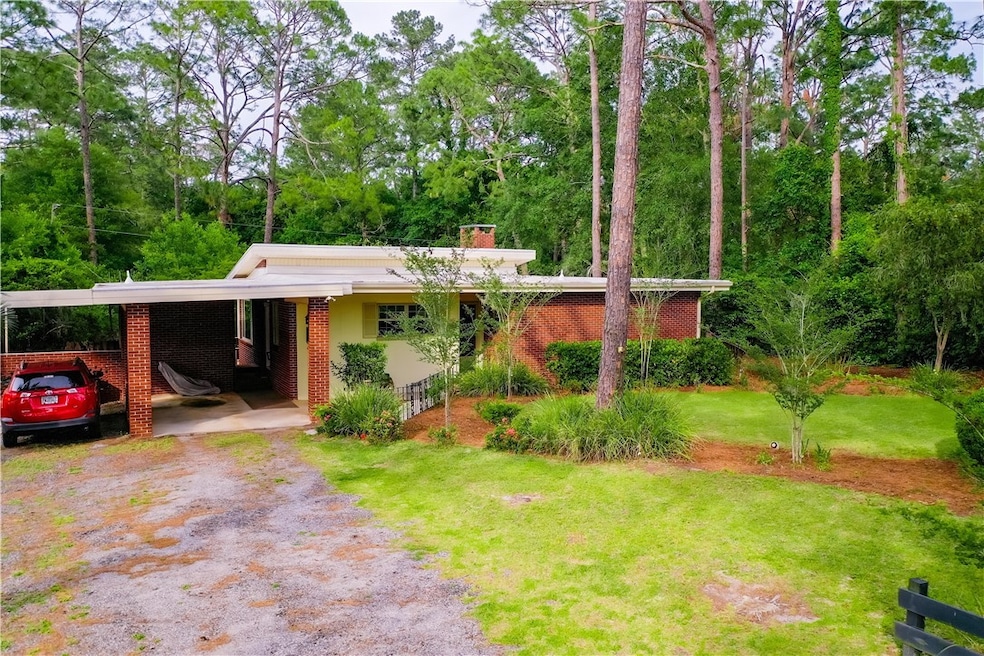
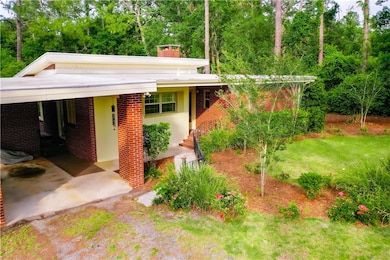
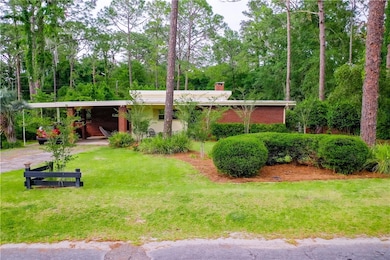

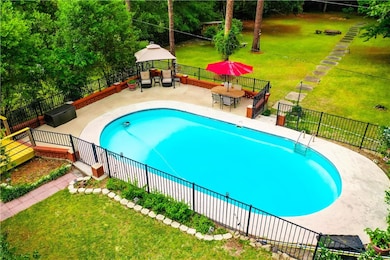
Here's a charming 2 bedroom, 1.5 bath home on 1.45 acres with pool and privacy - a rare find within the city limits!!! This unique property offers the perfect blend of space, comfort, and character, all nestled on 1.45 acres. Featuring 2 bedrooms and 1.5 baths, this all electric home is filled with charm and modern conveniences. Step inside to a warm and inviting kitchen equipped with an oven/range, refrigerator, dishwasher, and a cozy eat-in bar overlooking the spacious living/dining combo. The living area boasts beam ceilings, a wood-burning fireplace, built-ins, and pull-down shade blinds, all accented by large windows that flood the space with natural light and provide serene views of the backyard. The primary bedroom features hardwood floors and an attached tiled half bath, while the second bedroom is also spacious with hardwood flooring. The full bath includes tile finishes and a tub/shower combo. Step outside onto the brand-new open wood deck, perfect for entertaining or relaxing, which leads to an inground vinyl liner chlorine pool,. Beyond the pool lies a massive backyard, complete with a fire pit and plenty of privacy - ideal for enjoying the outdoors year-round. Chicken coop on property as well as a well for irrigation/pool purposes. Additional features include a dedicated laundry room, covered single-car parking, and a basement/storage area with an electrical box for the pool and well, plus a humidifier. This property is serviced by city water/sewer. GA Power. Property taxes approx $2500/year. New roof installed October 2022 by D&S Roofing, complete with a 5-year warranty. Don't miss this opportunity to own a spacious property with tons of character, privacy and outdoor living space - all within the convenience of city living. Call today!!!
Last Agent to Sell the Property
Compass360 Realty, Inc. License #294120 Listed on: 05/06/2025
| Date | Type | Sale Price | Title Company |
|---|---|---|---|
| Warranty Deed | $149,200 | -- | |
| Warranty Deed | $100,000 | -- | |
| Deed | $98,000 | -- | |
| Deed | $87,000 | -- | |
| Deed | -- | -- |
| Date | Status | Loan Amount | Loan Type |
|---|---|---|---|
| Previous Owner | $10,000,000 | Mortgage Modification | |
| Previous Owner | $97,231 | FHA |
| Date | Event | Price | List to Sale | Price per Sq Ft |
|---|---|---|---|---|
| 07/01/2025 07/01/25 | Sold | $205,800 | 0.0% | $164 / Sq Ft |
| 06/15/2025 06/15/25 | Pending | -- | -- | -- |
| 06/14/2025 06/14/25 | For Sale | $205,800 | 0.0% | $164 / Sq Ft |
| 06/02/2025 06/02/25 | Pending | -- | -- | -- |
| 05/06/2025 05/06/25 | For Sale | $205,800 | -- | $164 / Sq Ft |
| Year | Tax Paid | Tax Assessment Tax Assessment Total Assessment is a certain percentage of the fair market value that is determined by local assessors to be the total taxable value of land and additions on the property. | Land | Improvement |
|---|---|---|---|---|
| 2024 | $2,460 | $63,155 | $9,477 | $53,678 |
| 2023 | $2,178 | $57,921 | $4,342 | $53,579 |
| 2022 | $1,490 | $57,921 | $4,342 | $53,579 |
| 2021 | $1,548 | $47,345 | $4,342 | $43,003 |
| 2020 | $1,560 | $47,345 | $4,342 | $43,003 |
| 2019 | $1,647 | $37,247 | $4,342 | $32,905 |
| 2018 | $1,547 | $36,125 | $4,342 | $31,783 |
| 2017 | $1,510 | $36,125 | $4,342 | $31,783 |
| 2016 | $1,510 | $36,125 | $4,342 | $31,783 |
| 2015 | $1,520 | $36,125 | $4,342 | $31,783 |
| 2014 | $1,519 | $36,125 | $4,342 | $31,783 |
| 2013 | -- | $36,125 | $4,342 | $31,783 |
Seller's Agent in 2025
Jody Dupont
Compass360 Realty, Inc.
(912) 288-2282
495 Total Sales
Source: Golden Isles Association of REALTORS®
MLS Number: 1653814
APN: WA2003-084
Disclaimer: Certain information contained herein is derived from information provided by parties other than Homes.com. All information provided is deemed reliable, but is not guaranteed to be accurate and should be independently verified.
![]() IDX information is provided exclusively for personal, non-commercial use, and may not be used for any purpose other than to identify prospective properties consumers may be interested in purchasing. Information is deemed reliable but not guaranteed.
IDX information is provided exclusively for personal, non-commercial use, and may not be used for any purpose other than to identify prospective properties consumers may be interested in purchasing. Information is deemed reliable but not guaranteed.