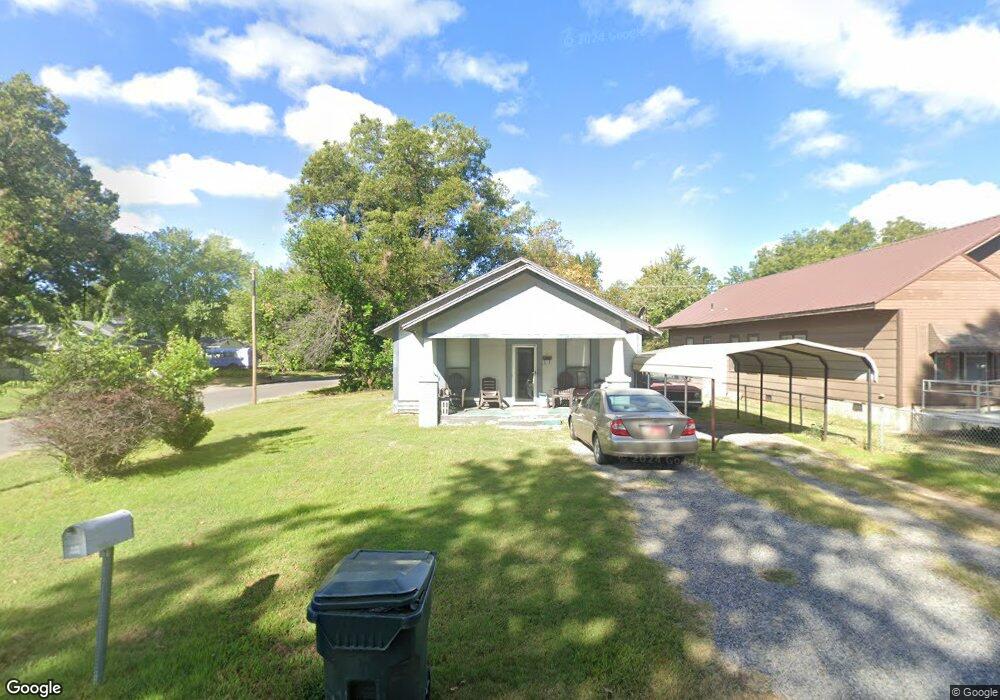
1303 Maple St Muskogee, OK 74403
Central Muskogee NeighborhoodEstimated Value: $72,324 - $113,000
3
Beds
1
Bath
962
Sq Ft
$89/Sq Ft
Est. Value
About This Home
This home is located at 1303 Maple St, Muskogee, OK 74403 and is currently estimated at $85,331, approximately $88 per square foot. 1303 Maple St is a home located in Muskogee County with nearby schools including Irving Elementary School, 8th & 9th Grade Academy @ Alice Robertson, and Muskogee High School.
Ownership History
Date
Name
Owned For
Owner Type
Purchase Details
Closed on
Mar 5, 2019
Sold by
Johnson Chantwan J and Johnson Raiena
Bought by
Johnson Chantwan J and Johnson Raiena
Current Estimated Value
Purchase Details
Closed on
Oct 26, 2006
Sold by
Territory National Bank Corp
Bought by
Johnson Chantwan J
Home Financials for this Owner
Home Financials are based on the most recent Mortgage that was taken out on this home.
Original Mortgage
$48,720
Interest Rate
6.41%
Mortgage Type
FHA
Purchase Details
Closed on
Apr 26, 2000
Purchase Details
Closed on
Aug 2, 1999
Purchase Details
Closed on
Mar 31, 1995
Purchase Details
Closed on
Feb 22, 1995
Purchase Details
Closed on
Jul 1, 1993
Purchase Details
Closed on
Jan 1, 1992
Purchase Details
Closed on
Jul 1, 1989
Create a Home Valuation Report for This Property
The Home Valuation Report is an in-depth analysis detailing your home's value as well as a comparison with similar homes in the area
Home Values in the Area
Average Home Value in this Area
Purchase History
| Date | Buyer | Sale Price | Title Company |
|---|---|---|---|
| Johnson Chantwan J | -- | None Available | |
| Johnson Chantwan J | $49,500 | None Available | |
| -- | $34,500 | -- | |
| -- | -- | -- | |
| -- | $22,000 | -- | |
| -- | -- | -- | |
| -- | $27,000 | -- | |
| -- | $19,500 | -- | |
| -- | $24,000 | -- |
Source: Public Records
Mortgage History
| Date | Status | Borrower | Loan Amount |
|---|---|---|---|
| Previous Owner | Johnson Chantwan J | $48,720 |
Source: Public Records
Tax History Compared to Growth
Tax History
| Year | Tax Paid | Tax Assessment Tax Assessment Total Assessment is a certain percentage of the fair market value that is determined by local assessors to be the total taxable value of land and additions on the property. | Land | Improvement |
|---|---|---|---|---|
| 2024 | $441 | $4,050 | $797 | $3,253 |
| 2023 | $441 | $3,857 | $578 | $3,279 |
| 2022 | $384 | $3,857 | $578 | $3,279 |
| 2021 | $549 | $5,485 | $440 | $5,045 |
| 2020 | $550 | $5,485 | $440 | $5,045 |
| 2019 | $546 | $5,485 | $440 | $5,045 |
| 2018 | $535 | $5,485 | $440 | $5,045 |
| 2017 | $517 | $5,485 | $440 | $5,045 |
| 2016 | $518 | $5,440 | $440 | $5,000 |
| 2015 | $513 | $5,440 | $440 | $5,000 |
| 2014 | $523 | $5,440 | $440 | $5,000 |
Source: Public Records
Map
Nearby Homes