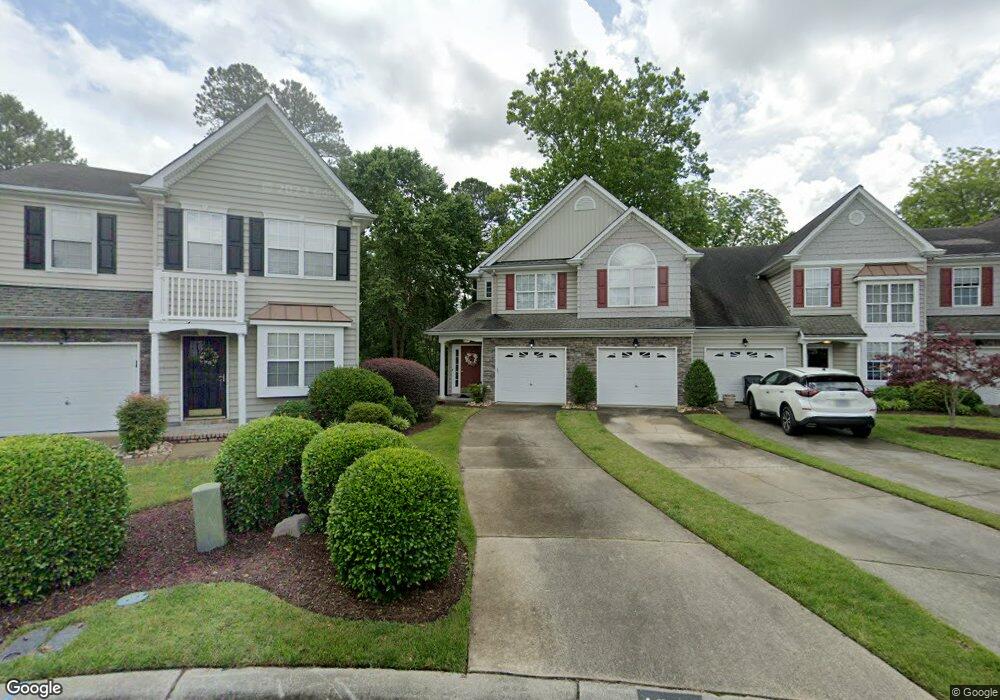
1303 Marsh Wren Cir Portsmouth, VA 23703
Churchland NeighborhoodEstimated Value: $272,000 - $284,379
2
Beds
2
Baths
1,626
Sq Ft
$170/Sq Ft
Est. Value
About This Home
This home is located at 1303 Marsh Wren Cir, Portsmouth, VA 23703 and is currently estimated at $276,845, approximately $170 per square foot. 1303 Marsh Wren Cir is a home located in Portsmouth City with nearby schools including Churchland Academy Elementary School, Churchland Elementary School, and Churchland Middle School.
Ownership History
Date
Name
Owned For
Owner Type
Purchase Details
Closed on
Nov 25, 2024
Sold by
Pierce Edith
Bought by
Benshish Michael and Benshish Laurey
Current Estimated Value
Home Financials for this Owner
Home Financials are based on the most recent Mortgage that was taken out on this home.
Original Mortgage
$206,250
Outstanding Balance
$204,118
Interest Rate
6.44%
Mortgage Type
New Conventional
Estimated Equity
$72,727
Purchase Details
Closed on
Nov 29, 2011
Sold by
Troutman Beverly L
Bought by
Pierce Edith
Home Financials for this Owner
Home Financials are based on the most recent Mortgage that was taken out on this home.
Original Mortgage
$136,000
Interest Rate
4.09%
Mortgage Type
New Conventional
Purchase Details
Closed on
Nov 29, 2002
Sold by
River Pointe Assocs Llc
Bought by
Troutman Beverly L
Create a Home Valuation Report for This Property
The Home Valuation Report is an in-depth analysis detailing your home's value as well as a comparison with similar homes in the area
Home Values in the Area
Average Home Value in this Area
Purchase History
| Date | Buyer | Sale Price | Title Company |
|---|---|---|---|
| Benshish Michael | $275,000 | Fidelity National Title | |
| Pierce Edith | $178,000 | -- | |
| Troutman Beverly L | $123,070 | -- |
Source: Public Records
Mortgage History
| Date | Status | Borrower | Loan Amount |
|---|---|---|---|
| Open | Benshish Michael | $206,250 | |
| Previous Owner | Pierce Edith | $136,000 |
Source: Public Records
Tax History Compared to Growth
Tax History
| Year | Tax Paid | Tax Assessment Tax Assessment Total Assessment is a certain percentage of the fair market value that is determined by local assessors to be the total taxable value of land and additions on the property. | Land | Improvement |
|---|---|---|---|---|
| 2025 | $3,302 | $280,220 | $70,000 | $210,220 |
| 2024 | $3,302 | $254,550 | $70,000 | $184,550 |
| 2023 | $2,921 | $233,690 | $70,000 | $163,690 |
| 2022 | $2,683 | $206,420 | $60,000 | $146,420 |
| 2021 | $2,430 | $186,920 | $40,500 | $146,420 |
| 2020 | $2,240 | $172,280 | $40,500 | $131,780 |
| 2019 | $2,240 | $172,280 | $40,500 | $131,780 |
| 2018 | $2,240 | $172,280 | $40,500 | $131,780 |
| 2017 | $2,240 | $172,280 | $40,500 | $131,780 |
| 2016 | $2,277 | $175,120 | $40,500 | $134,620 |
| 2015 | $2,277 | $175,120 | $40,500 | $134,620 |
| 2014 | $2,224 | $175,120 | $40,500 | $134,620 |
Source: Public Records
Map
Nearby Homes
- 2004 Sawgrass Ln
- 3609 Loon Ct
- 4412 Carlton Ct
- 3609 Linnet Ln
- 3832 New River Reach Unit A
- 6 Waterview Ct
- 3613 Cardinal Ln
- 3812 Falling River Reach Unit C
- 4239 Hatton Point Ln Unit 35
- 4808 Thornwood St
- 4257 Hatton Point Ln Unit 44
- 50 Centre Port Cir
- 3614 Jordan Ln
- 4613 Mallard Crescent
- 3728 Cardinal Ln
- 17 Centre Port Cir
- 4705 Templar Dr
- 4285 Hatton Point Ln
- 4286 Hatton Point Ln
- 1068 Estates Ct
- 1304 Marsh Wren Cir
- 1302 Marsh Wren Cir
- 1401 Marsh Wren Cir
- 1301 Marsh Wren Cir
- 1402 Marsh Wren Cir
- 1204 Marsh Wren Cir
- 1403 Marsh Wren Cir
- 1404 Marsh Wren Cir
- 1203 Marsh Wren Cir
- 1202 Marsh Wren Cir
- 1405 Marsh Wren Cir
- 1201 Marsh Wren Cir
- 1106 Sawgrass Ln
- 1106 Sawgrass Ln Unit 1106
- 1105 Sawgrass Ln
- 1105 Sawgrass Ln Unit 1-1105
- 1104 Sawgrass Ln
- 1103 Sawgrass Ln
- 1103 Sawgrass Ln Unit 1-1103
- 1101 Sawgrass Ln