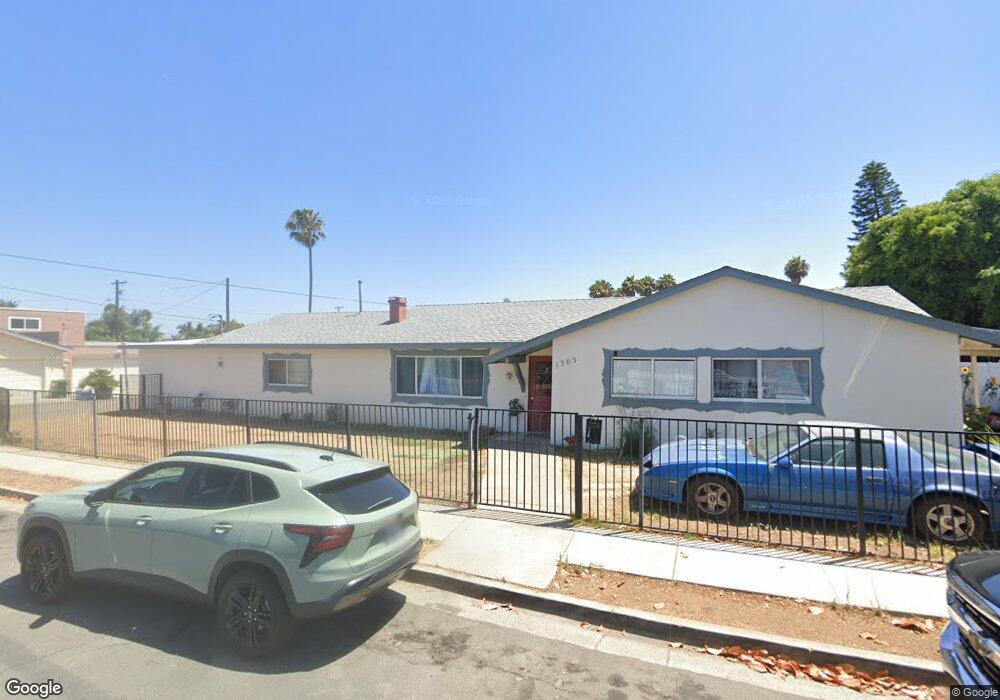
1303 Missouri Ave Oceanside, CA 92054
Downtown Oceanside NeighborhoodEstimated Value: $1,136,482 - $1,535,000
About This Home
This home is located at 1303 Missouri Ave, Oceanside, CA 92054 and is currently estimated at $1,275,121, approximately $945 per square foot. 1303 Missouri Ave is a home located in San Diego County with nearby schools including Laurel Elementary School, Lincoln Middle School, and Oceanside High School.
Ownership History
We collect this data history from publicly available records. To have your information removed, we recommend requesting removal directly through your county’s website.
Purchase Details
Purchase Details
Purchase Details
Home Values in the Area
Average Home Value in this Area
Purchase History
We collect this data history from publicly available records. To have your information removed, we recommend requesting removal directly through your county’s website.
| Date | Buyer | Sale Price | Title Company |
|---|---|---|---|
| -- | -- | ||
| -- | -- | ||
| $110,500 | -- |
Tax History
We collect this data history from publicly available records. To have your information removed, we recommend requesting removal directly through your county’s website.
| Year | Tax Paid | Tax Assessment Tax Assessment Total Assessment is a certain percentage of the fair market value that is determined by local assessors to be the total taxable value of land and additions on the property. | Land | Improvement |
|---|---|---|---|---|
| 2025 | $2,532 | $226,344 | $111,695 | $114,649 |
| 2024 | $2,532 | $221,906 | $109,505 | $112,401 |
| 2023 | $2,454 | $217,556 | $107,358 | $110,198 |
| 2022 | $2,417 | $213,291 | $105,253 | $108,038 |
| 2021 | $2,427 | $209,110 | $103,190 | $105,920 |
| 2020 | $2,353 | $206,966 | $102,132 | $104,834 |
| 2019 | $2,285 | $202,909 | $100,130 | $102,779 |
| 2018 | $2,261 | $198,931 | $98,167 | $100,764 |
| 2017 | $2,220 | $195,032 | $96,243 | $98,789 |
| 2016 | $2,148 | $191,208 | $94,356 | $96,852 |
| 2015 | $2,086 | $188,337 | $92,939 | $95,398 |
| 2014 | $2,007 | $184,649 | $91,119 | $93,530 |
Map
- 429 Garfield St
- 415 S Weitzel St
- 425 S Horne St
- 410 S Clementine St
- 427 S Clementine St
- 615 Vine St Unit 26
- 221 S Nevada St
- 1109 Hibiscus Way
- 525 S Freeman St
- 503 505 N Nevada St
- 722 &718 N Freeman St
- 123 S Nevada St
- 1115 Sea Glass Way
- 110 S Freeman St
- 550 Seagaze Dr Unit 26
- 550 Seagaze Dr Unit 23
- 550 Seagaze Dr Unit 29
- 550 Seagaze Dr Unit 19
- 550 Seagaze Dr Unit 2
- 114 S Tremont St
- 508 Grant St
- 512 Grant St
- 514 Grant St
- 1302 Missouri Ave
- 1306 Missouri Ave
- 501 Garfield St
- 503 Garfield St
- 505 Garfield St
- 516 Grant St Unit A
- 1312 Missouri Ave Guest House
- 505 Grant St
- 509 Garfield St
- 1312 Missouri Ave Unit Guest House
- 1312 Missouri Ave
- 520 Grant St
- 513 Garfield St
- 440 Grant St
- 1316 Missouri Ave
- 441 Grant St
- 519 Garfield St
Ask me questions while you tour the home.