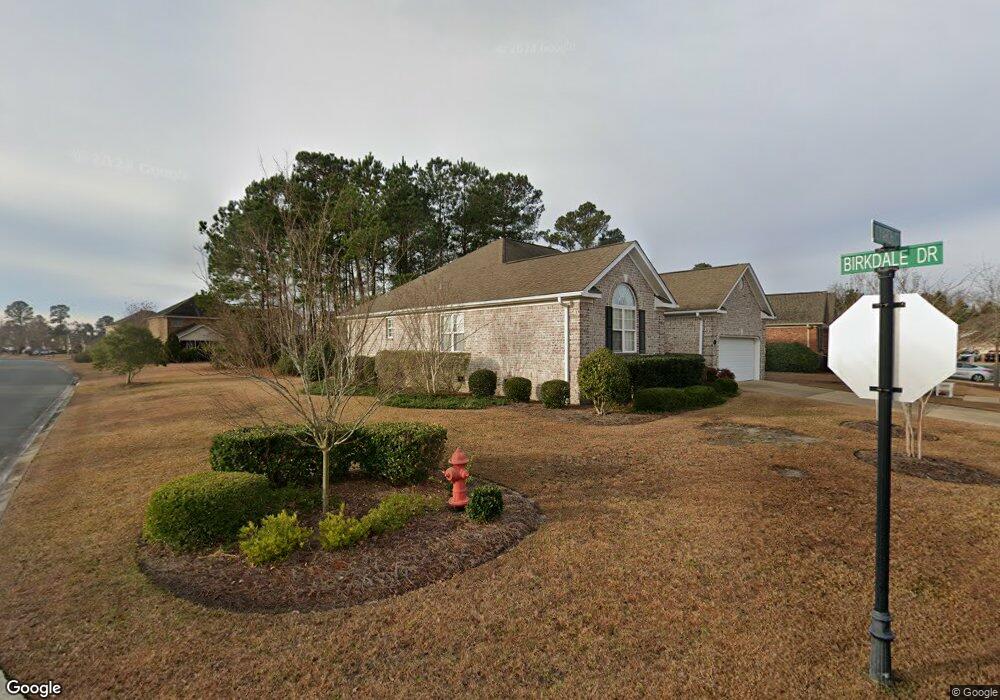
1303 Monarch Ct Winnabow, NC 28479
Estimated Value: $293,000 - $386,000
3
Beds
3
Baths
1,880
Sq Ft
$186/Sq Ft
Est. Value
About This Home
This home is located at 1303 Monarch Ct, Winnabow, NC 28479 and is currently estimated at $349,361, approximately $185 per square foot. 1303 Monarch Ct is a home located in Brunswick County with nearby schools including Belville Elementary School, Leland Middle School, and North Brunswick High School.
Ownership History
Date
Name
Owned For
Owner Type
Purchase Details
Closed on
Oct 31, 2024
Sold by
Neal Denise E and Dominesey Mark N
Bought by
Nance Chucky and Nance Jennifer R
Current Estimated Value
Purchase Details
Closed on
Oct 5, 2005
Sold by
Premier Homes Of Wilmington Inc
Bought by
Sobieski Elizabeth A
Create a Home Valuation Report for This Property
The Home Valuation Report is an in-depth analysis detailing your home's value as well as a comparison with similar homes in the area
Home Values in the Area
Average Home Value in this Area
Purchase History
| Date | Buyer | Sale Price | Title Company |
|---|---|---|---|
| Nance Chucky | $295,000 | None Listed On Document | |
| Sobieski Elizabeth A | $64,500 | None Available |
Source: Public Records
Tax History Compared to Growth
Tax History
| Year | Tax Paid | Tax Assessment Tax Assessment Total Assessment is a certain percentage of the fair market value that is determined by local assessors to be the total taxable value of land and additions on the property. | Land | Improvement |
|---|---|---|---|---|
| 2025 | $2,457 | $368,720 | $55,000 | $313,720 |
| 2024 | $2,457 | $368,720 | $55,000 | $313,720 |
| 2023 | $1,938 | $368,720 | $55,000 | $313,720 |
| 2022 | $1,938 | $241,170 | $45,000 | $196,170 |
| 2021 | $1,938 | $241,170 | $45,000 | $196,170 |
| 2020 | $1,841 | $241,170 | $45,000 | $196,170 |
| 2019 | $1,826 | $46,320 | $45,000 | $1,320 |
| 2018 | $1,710 | $41,580 | $40,000 | $1,580 |
| 2017 | $1,710 | $41,580 | $40,000 | $1,580 |
| 2016 | $1,624 | $41,580 | $40,000 | $1,580 |
| 2015 | $1,552 | $228,080 | $40,000 | $188,080 |
| 2014 | $1,451 | $227,496 | $50,000 | $177,496 |
Source: Public Records
Map
Nearby Homes
- 1206 Birkdale Dr
- 1105 Avebury Ct
- 207 N Palm Dr
- 796 Beachwalk Dr
- 195 N Palm Dr
- 745 Beachwalk Dr
- 511 Heartwood Dr
- 808 Greystone Ct Unit 12B
- 546 Heartwood Dr
- 707 Beachwalk Dr
- 368 St Kitts Way
- 3318 Hemlock Way
- 2197 N Palm Dr
- 199 Tylers Cove Way
- 420 Saint Kitts Way
- 1230 Needleleaf Dr
- 3330 Hemlock Way Unit Lot 128
- 504 Horton Place
- 115 Cove Landing
- 136 N Palm Dr
- 1305 Monarch Ct
- 1302 Wakefield Ct
- 1224 Birkdale Dr
- 1224 Birkdale Dr Unit 46C
- 1222 Birkdale Dr
- 1226 Birkdale Dr
- 1220 Birkdale Dr
- 1307 Monarch Ct
- 1304 Wakefield Ct
- 1302 Monarch Ct
- 1216 Birkdale Dr
- 1304 Monarch Ct
- 1232 Birkdale Dr
- 1214 Birkdale Dr
- 1306 Monarch Ct
- 1234 Birkdale Dr
- 1212 Birkdale Dr
- 1309 Monarch Ct
- 1236 Birkdale Dr
- 1308 Monarch Ct