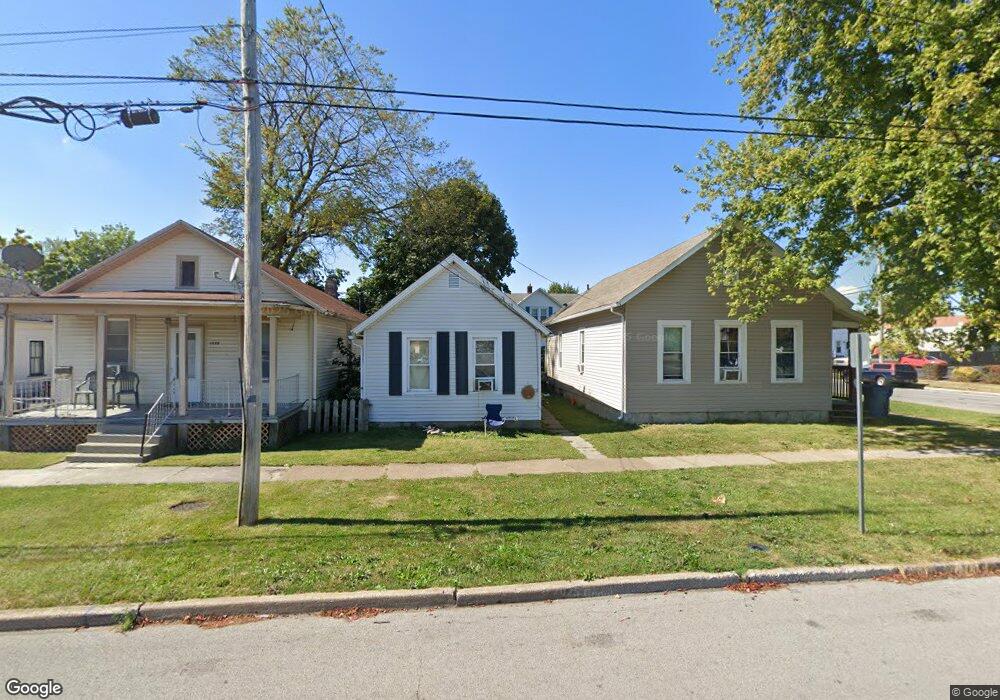
1303 Prospect St Sandusky, OH 44870
Estimated Value: $70,996 - $108,000
3
Beds
1
Bath
832
Sq Ft
$100/Sq Ft
Est. Value
About This Home
This home is located at 1303 Prospect St, Sandusky, OH 44870 and is currently estimated at $82,999, approximately $99 per square foot. 1303 Prospect St is a home located in Erie County with nearby schools including Sandusky High School, Monroe Preparatory Academy, and Sandusky Central Catholic School.
Ownership History
Date
Name
Owned For
Owner Type
Purchase Details
Closed on
Sep 22, 2020
Sold by
Yetter Matthew E and Yetter Lynne C
Bought by
Gio & Sal Properties Llc
Current Estimated Value
Purchase Details
Closed on
Jan 12, 1996
Sold by
Harmon Gary
Bought by
Yetter Matthew E and Yetter Lynne C
Home Financials for this Owner
Home Financials are based on the most recent Mortgage that was taken out on this home.
Original Mortgage
$19,600
Interest Rate
7.36%
Mortgage Type
New Conventional
Create a Home Valuation Report for This Property
The Home Valuation Report is an in-depth analysis detailing your home's value as well as a comparison with similar homes in the area
Home Values in the Area
Average Home Value in this Area
Purchase History
| Date | Buyer | Sale Price | Title Company |
|---|---|---|---|
| Gio & Sal Properties Llc | $20,000 | Fidelity National Ttl Co Llc | |
| Yetter Matthew E | $28,000 | -- |
Source: Public Records
Mortgage History
| Date | Status | Borrower | Loan Amount |
|---|---|---|---|
| Previous Owner | Yetter Matthew E | $19,600 |
Source: Public Records
Tax History Compared to Growth
Tax History
| Year | Tax Paid | Tax Assessment Tax Assessment Total Assessment is a certain percentage of the fair market value that is determined by local assessors to be the total taxable value of land and additions on the property. | Land | Improvement |
|---|---|---|---|---|
| 2024 | $710 | $18,017 | $1,837 | $16,180 |
| 2023 | $710 | $7,693 | $1,470 | $6,223 |
| 2022 | $409 | $7,693 | $1,470 | $6,223 |
| 2021 | $393 | $7,690 | $1,470 | $6,220 |
| 2020 | $684 | $12,290 | $1,470 | $10,820 |
| 2019 | $703 | $12,290 | $1,470 | $10,820 |
| 2018 | $704 | $12,290 | $1,470 | $10,820 |
| 2017 | $712 | $12,380 | $1,580 | $10,800 |
| 2016 | $711 | $12,380 | $1,580 | $10,800 |
| 2015 | $644 | $12,380 | $1,580 | $10,800 |
| 2014 | $640 | $12,380 | $1,580 | $10,800 |
| 2013 | $634 | $12,380 | $1,580 | $10,800 |
Source: Public Records
Map
Nearby Homes