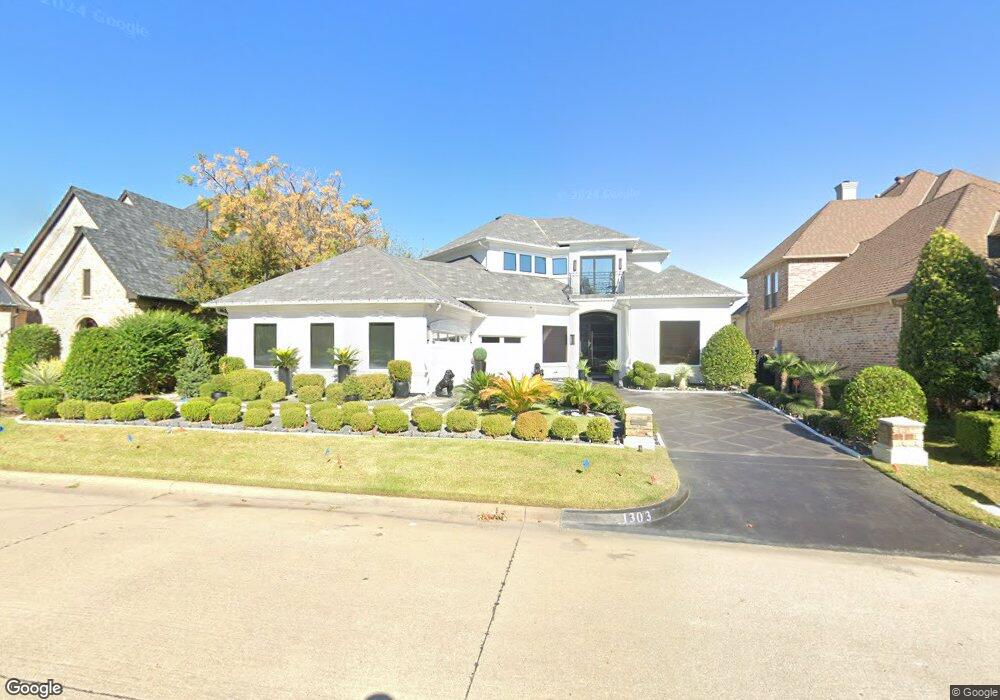
1303 Regency Ct Southlake, TX 76092
Estimated Value: $1,237,159 - $1,435,000
3
Beds
5
Baths
3,659
Sq Ft
$373/Sq Ft
Est. Value
About This Home
This home is located at 1303 Regency Ct, Southlake, TX 76092 and is currently estimated at $1,365,290, approximately $373 per square foot. 1303 Regency Ct is a home located in Tarrant County with nearby schools including Old Union Elementary School, Eubanks Intermediate School, and George Dawson Middle School.
Ownership History
Date
Name
Owned For
Owner Type
Purchase Details
Closed on
Aug 23, 2005
Sold by
Mcdevitt Donald T and Mcdevitt Susan
Bought by
Diepholz Koy W
Current Estimated Value
Home Financials for this Owner
Home Financials are based on the most recent Mortgage that was taken out on this home.
Original Mortgage
$488,000
Outstanding Balance
$255,529
Interest Rate
5.61%
Mortgage Type
Fannie Mae Freddie Mac
Estimated Equity
$1,109,761
Purchase Details
Closed on
Dec 3, 1997
Sold by
Sobeco Llc
Bought by
Mcdevitt Donald T and Mcdevitt Susan
Home Financials for this Owner
Home Financials are based on the most recent Mortgage that was taken out on this home.
Original Mortgage
$250,000
Interest Rate
7.2%
Purchase Details
Closed on
May 28, 1997
Sold by
Westerra Timarron Lp
Bought by
Paul Wright Custom Homes and Sobeco Llc
Create a Home Valuation Report for This Property
The Home Valuation Report is an in-depth analysis detailing your home's value as well as a comparison with similar homes in the area
Home Values in the Area
Average Home Value in this Area
Purchase History
| Date | Buyer | Sale Price | Title Company |
|---|---|---|---|
| Diepholz Koy W | -- | Alamo Title Company | |
| Mcdevitt Donald T | -- | American Title Co | |
| Paul Wright Custom Homes | -- | Stewart Title |
Source: Public Records
Mortgage History
| Date | Status | Borrower | Loan Amount |
|---|---|---|---|
| Open | Diepholz Koy W | $488,000 | |
| Previous Owner | Mcdevitt Donald T | $250,000 |
Source: Public Records
Tax History Compared to Growth
Tax History
| Year | Tax Paid | Tax Assessment Tax Assessment Total Assessment is a certain percentage of the fair market value that is determined by local assessors to be the total taxable value of land and additions on the property. | Land | Improvement |
|---|---|---|---|---|
| 2025 | $14,067 | $1,131,064 | $250,000 | $881,064 |
| 2024 | $14,067 | $1,131,064 | $250,000 | $881,064 |
| 2023 | $18,041 | $1,197,407 | $250,000 | $947,407 |
| 2022 | $19,413 | $1,018,119 | $175,000 | $843,119 |
| 2021 | $18,651 | $818,013 | $175,000 | $643,013 |
| 2020 | $18,872 | $821,019 | $175,000 | $646,019 |
| 2019 | $20,107 | $830,366 | $175,000 | $655,366 |
| 2018 | $17,431 | $762,219 | $210,000 | $552,219 |
| 2017 | $18,175 | $733,271 | $210,000 | $523,271 |
| 2016 | $16,866 | $680,476 | $210,000 | $470,476 |
| 2015 | $15,794 | $722,972 | $150,000 | $572,972 |
| 2014 | $15,794 | $651,300 | $82,500 | $568,800 |
Source: Public Records
Map
Nearby Homes
- 1420 Kensington Ct
- 608 Regency Crossing
- 1227 Strathmore Dr
- 521 Regency Crossing
- 710 Longford Dr
- 708 Nettleton Dr
- 7322 Calloway Ct
- 7316 Calloway Ct
- 1417 Nottoway Ct
- 1418 Nottoway Ct
- 1406 Nottoway Ct
- 1100 La Paloma Ct
- 1719 Byron Nelson Pkwy
- 7208 Stilton Ct
- 1012 Cool River Dr
- 1401 Chardonnay Ct
- 7106 Belle Meade Dr
- 712 Ashleigh Ln
- 7200 Belle Meade Dr
- 7312 Hix Ct
- 1305 Regency Ct
- 1301 Regency Ct
- 1307 Regency Ct
- 1304 Regency Ct
- 1309 Regency Ct
- 1306 Regency Ct
- 1308 Regency Ct
- 1311 Regency Ct
- 1310 Regency Ct
- 1313 Regency Ct
- 642 Chandon Ct
- 639 Chandon Ct
- 1312 Regency Ct
- 640 Chandon Ct
- 1315 Regency Ct
- 637 Chandon Ct
- 638 Chandon Ct
- 638 Regency Crossing
- 635 Chandon Ct
- 1312 Byron Nelson Pkwy