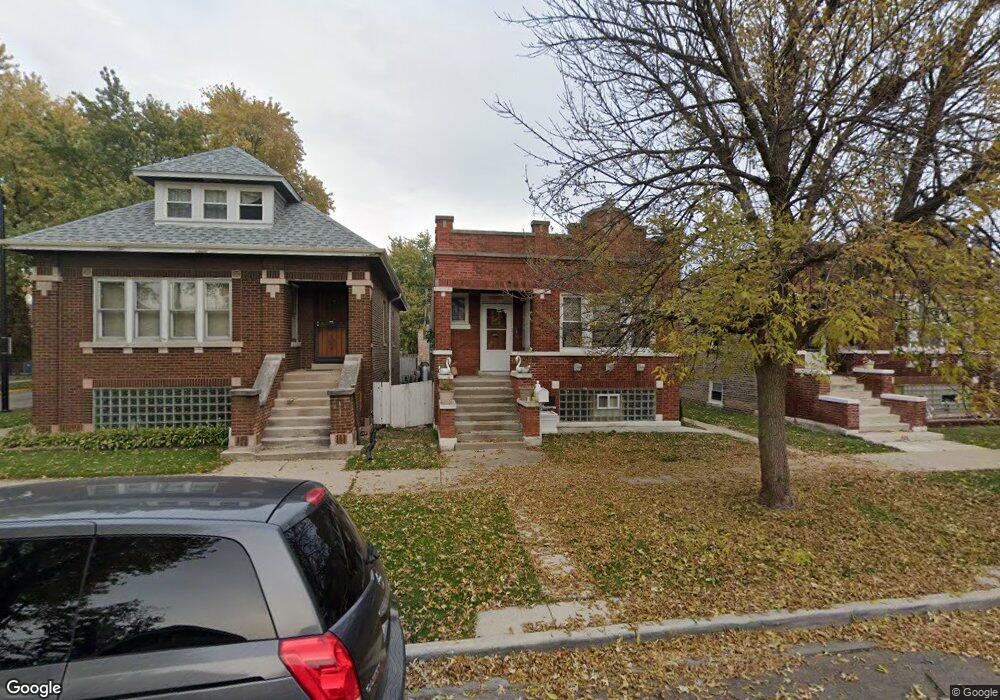
1303 S 61st Ct Cicero, IL 60804
Estimated Value: $252,000 - $301,000
3
Beds
1
Bath
1,196
Sq Ft
$235/Sq Ft
Est. Value
About This Home
This home is located at 1303 S 61st Ct, Cicero, IL 60804 and is currently estimated at $281,629, approximately $235 per square foot. 1303 S 61st Ct is a home located in Cook County with nearby schools including Warren Park Elementary School, J Sterling Morton Freshman Center, and Unity Jr High School.
Ownership History
Date
Name
Owned For
Owner Type
Purchase Details
Closed on
Sep 17, 2001
Sold by
Valverde Margarita
Bought by
Valverde Antonio and Valverde Antonio
Current Estimated Value
Home Financials for this Owner
Home Financials are based on the most recent Mortgage that was taken out on this home.
Original Mortgage
$124,000
Interest Rate
6.69%
Purchase Details
Closed on
Apr 30, 1997
Sold by
Manella Pauline V
Bought by
Valverde Margarita and Valverde Antonio
Home Financials for this Owner
Home Financials are based on the most recent Mortgage that was taken out on this home.
Original Mortgage
$99,335
Interest Rate
8.05%
Mortgage Type
FHA
Purchase Details
Closed on
Dec 16, 1994
Sold by
Manella Mark I
Bought by
Manella Pauline V
Purchase Details
Closed on
Sep 16, 1994
Sold by
American National Bk & Tr Co Of Chicago
Bought by
Manella Mark I
Create a Home Valuation Report for This Property
The Home Valuation Report is an in-depth analysis detailing your home's value as well as a comparison with similar homes in the area
Home Values in the Area
Average Home Value in this Area
Purchase History
| Date | Buyer | Sale Price | Title Company |
|---|---|---|---|
| Valverde Antonio | -- | -- | |
| Valverde Margarita | $100,000 | 1St American Title | |
| Manella Pauline V | -- | -- | |
| Manella Mark I | -- | -- |
Source: Public Records
Mortgage History
| Date | Status | Borrower | Loan Amount |
|---|---|---|---|
| Closed | Valverde Antonio | $124,000 | |
| Closed | Valverde Margarita | $99,335 |
Source: Public Records
Tax History Compared to Growth
Tax History
| Year | Tax Paid | Tax Assessment Tax Assessment Total Assessment is a certain percentage of the fair market value that is determined by local assessors to be the total taxable value of land and additions on the property. | Land | Improvement |
|---|---|---|---|---|
| 2024 | $3,732 | $17,000 | $4,605 | $12,395 |
| 2023 | $2,964 | $17,000 | $4,605 | $12,395 |
| 2022 | $2,964 | $12,944 | $3,963 | $8,981 |
| 2021 | $1,515 | $12,943 | $3,962 | $8,981 |
| 2020 | $4,130 | $12,943 | $3,962 | $8,981 |
| 2019 | $3,102 | $9,788 | $3,641 | $6,147 |
| 2018 | $3,020 | $9,788 | $3,641 | $6,147 |
| 2017 | $3,480 | $10,980 | $3,641 | $7,339 |
| 2016 | $3,148 | $9,057 | $2,998 | $6,059 |
| 2015 | $3,051 | $9,057 | $2,998 | $6,059 |
| 2014 | $2,965 | $9,057 | $2,998 | $6,059 |
| 2013 | $3,449 | $10,976 | $2,998 | $7,978 |
Source: Public Records
Map
Nearby Homes
- 1318 S 61st Ct
- 1313 Harvey Ave
- 1336 S Austin Blvd
- 1182 S Taylor Ave
- 1173 S Taylor Ave
- 1165 S Humphrey Ave
- 1501 S 61st Ct
- 1345 S Cuyler Ave
- 1310 S 59th Ave
- 1413 Cuyler Ave
- 5 Fillmore St Unit 3
- 1222 Cuyler Ave
- 1336 Cuyler Ave
- 6337 Roosevelt Rd Unit 103
- 6337 Roosevelt Rd Unit 309
- 6337 Roosevelt Rd Unit 107
- 6337 Roosevelt Rd Unit 308
- 1140 S Harvey Ave
- 1505 Highland Ave
- 1314 S 58th Ct
- 1301 S 61st Ct
- 1305 S 61st Ct
- 1309 S 61st Ct
- 1247 S 61st Ct
- 1315 S 61st Ct
- 1300 S 61st Ave
- 1304 S 61st Ave
- 1306 S 61st Ave
- 1302 S 61st Ave Unit 2
- 1302 S 61st Ave Unit 1
- 1245 S 61st Ct
- 1317 S 61st Ct
- 1308 S 61st Ave
- 1302 S 61st Ct
- 1246 S 61st Ave
- 1306 S 61st Ct
- 1310 S 61st Ave
- 1300 S 61st Ct
- 1319 S 61st Ct
- 1243 S 61st Ct Unit G