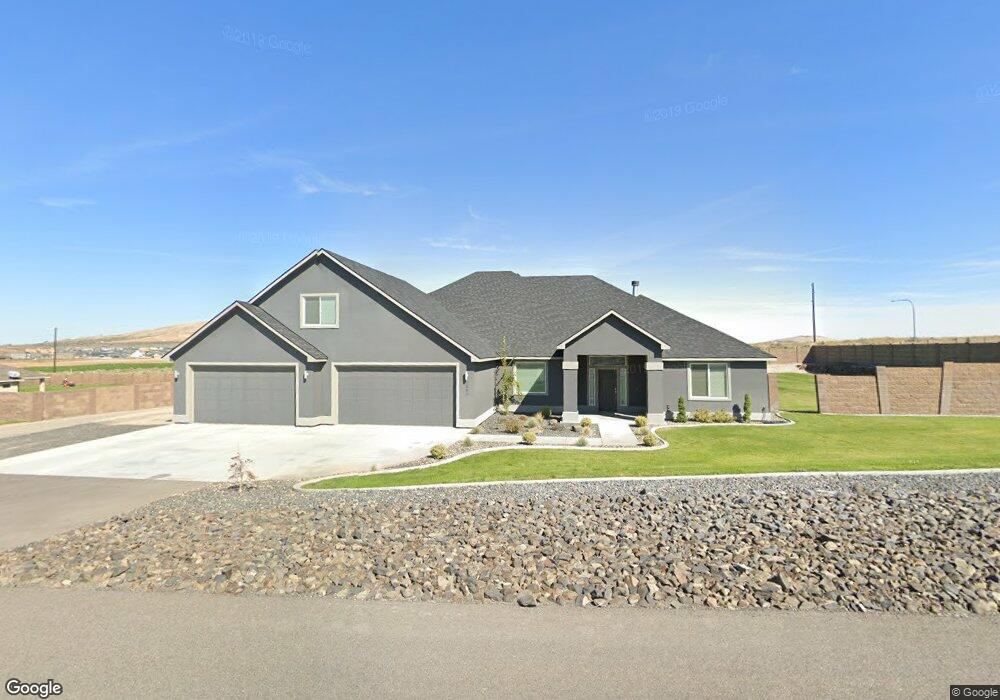
1303 S Coulee Vista Dr Unit Welcome Home! Kennewick, WA 99338
Estimated Value: $877,000 - $963,000
4
Beds
3
Baths
3,049
Sq Ft
$304/Sq Ft
Est. Value
About This Home
This home is located at 1303 S Coulee Vista Dr Unit Welcome Home!, Kennewick, WA 99338 and is currently estimated at $925,746, approximately $303 per square foot. 1303 S Coulee Vista Dr Unit Welcome Home! is a home located in Benton County with nearby schools including Cottonwood Elementary School, Desert Hills Middle School, and Kamiakin High School.
Ownership History
Date
Name
Owned For
Owner Type
Purchase Details
Closed on
Nov 4, 2018
Sold by
Brooks Nicholas and Brooks Kelli
Bought by
Brown Dale J
Current Estimated Value
Home Financials for this Owner
Home Financials are based on the most recent Mortgage that was taken out on this home.
Original Mortgage
$325,000
Outstanding Balance
$286,350
Interest Rate
4.9%
Mortgage Type
New Conventional
Estimated Equity
$639,396
Purchase Details
Closed on
May 10, 2016
Sold by
Stonecrest Builders Inc
Bought by
Brooks Nicholas and Brooks Kelli
Home Financials for this Owner
Home Financials are based on the most recent Mortgage that was taken out on this home.
Original Mortgage
$526,474
Interest Rate
3.71%
Mortgage Type
VA
Purchase Details
Closed on
Sep 3, 2015
Sold by
Tri City Development Corporation
Bought by
Stonecrest Builders Inc
Create a Home Valuation Report for This Property
The Home Valuation Report is an in-depth analysis detailing your home's value as well as a comparison with similar homes in the area
Home Values in the Area
Average Home Value in this Area
Purchase History
| Date | Buyer | Sale Price | Title Company |
|---|---|---|---|
| Brown Dale J | $597,000 | Chicago Title | |
| Brooks Nicholas | $552,592 | Benton Franklin Title Co | |
| Stonecrest Builders Inc | $53,441 | Chicago Title |
Source: Public Records
Mortgage History
| Date | Status | Borrower | Loan Amount |
|---|---|---|---|
| Open | Brown Dale J | $325,000 | |
| Previous Owner | Brooks Nicholas | $526,474 |
Source: Public Records
Tax History Compared to Growth
Tax History
| Year | Tax Paid | Tax Assessment Tax Assessment Total Assessment is a certain percentage of the fair market value that is determined by local assessors to be the total taxable value of land and additions on the property. | Land | Improvement |
|---|---|---|---|---|
| 2024 | $7,597 | $847,410 | $170,000 | $677,410 |
| 2023 | $7,597 | $847,410 | $170,000 | $677,410 |
| 2022 | $6,875 | $687,940 | $60,000 | $627,940 |
| 2021 | $6,004 | $632,540 | $60,000 | $572,540 |
| 2020 | $5,817 | $540,200 | $60,000 | $480,200 |
| 2019 | $5,223 | $503,250 | $60,000 | $443,250 |
| 2018 | $5,781 | $466,320 | $60,000 | $406,320 |
| 2017 | $5,633 | $429,380 | $60,000 | $369,380 |
| 2016 | $740 | $451,840 | $58,000 | $393,840 |
| 2015 | -- | $58,000 | $58,000 | $0 |
Source: Public Records
Map
Nearby Homes
- 72502 E Reata Rd
- 1605 S 717 Prairie SE
- 72905 E Grand Bluff Loop
- 4204 S Coulee Vista Dr
- 114 727 Prairie SE
- 74303 E Grand Bluff Loop
- 4827 Village View St
- 2573 Brodie Ln
- 4808 Harlan Ct
- 4629 Village View St
- 4801 White Dr
- 71421 E Sundown Prairie SE
- 2613 Morris Ave
- 2504 Brodie Ln
- 7419 Haystack St
- 76704 E Timothy Ln
- 4707 Jodie St
- 4708 Jodie St
- 2574 Sunray Ave
- 5026 Smitty Dr
- 1303 S Coulee Vista Dr
- 1303 S Coulee Vista Dr Unit Spacious Home w/Shop
- 1005 Coulee Vista Dr
- 1005 Coulee Vista Dr Unit Pre-Sale
- 1505 Coulee Vista Dr
- 73003 Landon Ln
- 1404 Coulee Vista Dr
- 1906 Coulee Vista Dr
- 1906 Coulee Vista Dr Unit The Prasada at The R
- 1906 Coulee Vista Dr Unit THE PRASADA BY VIKIN
- 705 Coulee Vista Dr
- 705 Coulee Vista Dr Unit Spectacular Titan Ho
- 2103 S Coulee Vista Dr
- 1002 Coulee Vista Dr
- 72805 Landon Ln
- 72805 Landon Ln Unit 4 Car Garage .50 acr
- 72805 Landon Ln Unit Nearly NEW on 1/2 ac
- 72804 Landon Ln
- 72804 Landon Ln Unit Room for a Shop and
- 72804 Landon Ln Unit CUSTOM HOME W/2ND SU