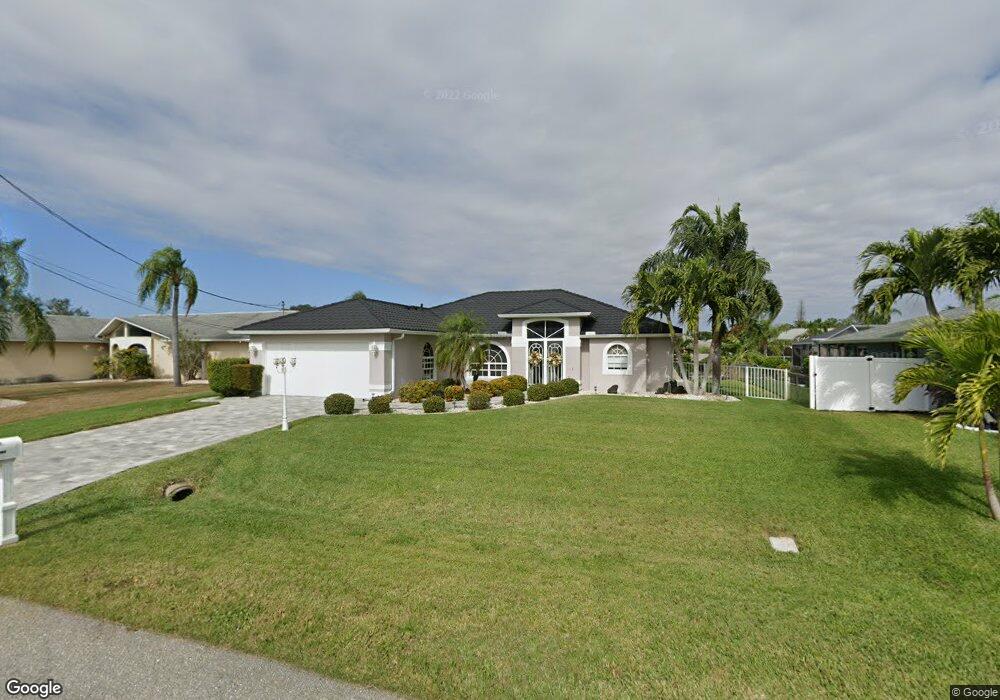
1303 SE 16th St Cape Coral, FL 33990
Hancock NeighborhoodEstimated Value: $490,370 - $545,000
3
Beds
2
Baths
2,340
Sq Ft
$222/Sq Ft
Est. Value
About This Home
This home is located at 1303 SE 16th St, Cape Coral, FL 33990 and is currently estimated at $519,343, approximately $221 per square foot. 1303 SE 16th St is a home located in Lee County with nearby schools including Caloosa Elementary School, Cape Elementary School, and Tropic Isles Elementary School.
Ownership History
Date
Name
Owned For
Owner Type
Purchase Details
Closed on
Dec 13, 2012
Sold by
Tirotta Michael and Tirotta Sharon
Bought by
Tirotta Michael and Tirotta Sharon K
Current Estimated Value
Purchase Details
Closed on
Feb 21, 2012
Sold by
Goehring Klaus Peter
Bought by
Tirotta Michael and Tirotta Sharon
Purchase Details
Closed on
Feb 28, 2005
Sold by
Garceau Joseph and Loverde Jacqueline
Bought by
Goehring Klaus Peter
Purchase Details
Closed on
Feb 13, 2004
Sold by
Garceau Joseph N and Garceau Jacqueline Deangelis
Bought by
Garceau Joseph N and Garceau Jacqueline Deangelis
Purchase Details
Closed on
Oct 16, 2002
Sold by
Garceau Joseph N and Garceau Jacqueline Deangelis
Bought by
Garceau Joseph N
Purchase Details
Closed on
Sep 28, 1999
Sold by
Keim Ann M
Bought by
Garceau Joseph N
Purchase Details
Closed on
Feb 10, 1999
Sold by
Keim Ann M and Keim Elwood
Bought by
Keim William D and Keim Carie A
Create a Home Valuation Report for This Property
The Home Valuation Report is an in-depth analysis detailing your home's value as well as a comparison with similar homes in the area
Home Values in the Area
Average Home Value in this Area
Purchase History
| Date | Buyer | Sale Price | Title Company |
|---|---|---|---|
| Tirotta Michael | -- | None Available | |
| Tirotta Michael | $250,000 | Title Junction Llc | |
| Goehring Klaus Peter | $455,000 | Island Title Guaranty Agency | |
| Garceau Joseph N | -- | -- | |
| Garceau Joseph N | -- | -- | |
| Garceau Joseph N | $14,500 | -- | |
| Keim Ann M | -- | -- | |
| Keim William D | $12,000 | -- |
Source: Public Records
Tax History Compared to Growth
Tax History
| Year | Tax Paid | Tax Assessment Tax Assessment Total Assessment is a certain percentage of the fair market value that is determined by local assessors to be the total taxable value of land and additions on the property. | Land | Improvement |
|---|---|---|---|---|
| 2025 | $7,024 | $434,041 | $151,003 | $240,099 |
| 2024 | $8,199 | $437,912 | $142,890 | $247,238 |
| 2023 | $8,199 | $413,802 | $0 | $0 |
| 2022 | $7,412 | $376,184 | $0 | $0 |
| 2021 | $6,541 | $342,522 | $97,344 | $245,178 |
| 2020 | $6,209 | $310,895 | $74,000 | $236,895 |
| 2019 | $5,826 | $291,509 | $64,000 | $227,509 |
| 2018 | $6,008 | $294,735 | $64,000 | $230,735 |
| 2017 | $5,708 | $272,925 | $62,000 | $210,925 |
| 2016 | $5,591 | $264,998 | $74,142 | $190,856 |
| 2015 | $5,266 | $242,597 | $70,899 | $171,698 |
| 2014 | $5,439 | $245,599 | $70,340 | $175,259 |
| 2013 | -- | $242,907 | $52,927 | $189,980 |
Source: Public Records
Map
Nearby Homes
- 1314 SE 15th Terrace
- 1215 SE 16th St
- 1404 SE 15th St
- 1405 SE 17th St
- 1318 SE 14th St
- 1104 SE 16th Terrace
- 1421 SE 14th Terrace
- 1449 SE 16th St
- 1453 SE 15th Terrace
- 1416 SE 11th Place
- 1518 SE 11th Ave
- 1903 SE 13th Terrace
- 1024 SE 14th Terrace
- 1105 SE 17th Terrace
- 1447 SE 17th Terrace
- 1439 SE 18th St
- 1222 SE 18th Terrace
- 1518 SE 10th Place
- 1216 SE 13th Ave
- 307 SE 13th St
- 1307 SE 16th St
- 1219 SE 16th St
- 1311 SE 16th St
- 1302 SE 16th St
- 1306 SE 16th St
- 1306 SE 15th Terrace
- 1302 SE 15th Terrace
- 1218 SE 16th St
- 1310 SE 15th Terrace
- 1310 SE 16th St
- 1315 SE 16th St
- 1211 SE 16th St
- 1214 SE 16th St
- 1314 SE 16th St
- 1303 SE 16th Terrace
- 1307 SE 16th Terrace
- 1207 SE 16th St
- 1319 SE 16th St
- 1217 SE 16th Terrace
- 1318 SE 15th Terrace Unit 22