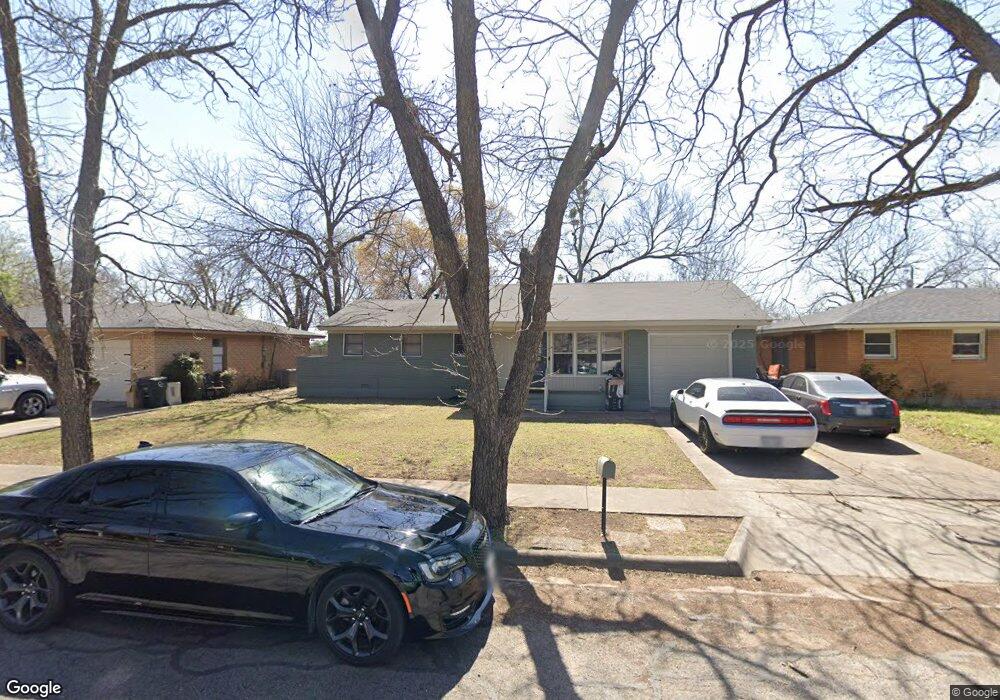
1303 Southern Blvd Cleburne, TX 76033
Estimated Value: $192,342 - $241,000
2
Beds
2
Baths
1,268
Sq Ft
$169/Sq Ft
Est. Value
About This Home
This home is located at 1303 Southern Blvd, Cleburne, TX 76033 and is currently estimated at $213,836, approximately $168 per square foot. 1303 Southern Blvd is a home located in Johnson County with nearby schools including Cooke Elementary School, A.D. Wheat Middle School, and Cleburne High School.
Ownership History
Date
Name
Owned For
Owner Type
Purchase Details
Closed on
Jul 23, 2014
Sold by
Montgomery Daniel and Miracle Amanda
Bought by
Thresher Blasita
Current Estimated Value
Purchase Details
Closed on
Aug 18, 2006
Sold by
Genore Shawn A
Bought by
Montgomery Daniel and Miracle Amanda
Home Financials for this Owner
Home Financials are based on the most recent Mortgage that was taken out on this home.
Original Mortgage
$85,655
Interest Rate
6.75%
Mortgage Type
FHA
Purchase Details
Closed on
Aug 30, 2005
Sold by
Rancy Gary Eugene
Bought by
Genore Shawn A
Home Financials for this Owner
Home Financials are based on the most recent Mortgage that was taken out on this home.
Original Mortgage
$64,900
Interest Rate
5.78%
Mortgage Type
VA
Create a Home Valuation Report for This Property
The Home Valuation Report is an in-depth analysis detailing your home's value as well as a comparison with similar homes in the area
Home Values in the Area
Average Home Value in this Area
Purchase History
| Date | Buyer | Sale Price | Title Company |
|---|---|---|---|
| Thresher Blasita | -- | Stewart | |
| Montgomery Daniel | -- | Stnt | |
| Genore Shawn A | -- | Stnt |
Source: Public Records
Mortgage History
| Date | Status | Borrower | Loan Amount |
|---|---|---|---|
| Previous Owner | Montgomery Daniel | $85,655 | |
| Previous Owner | Genore Shawn A | $64,900 |
Source: Public Records
Tax History Compared to Growth
Tax History
| Year | Tax Paid | Tax Assessment Tax Assessment Total Assessment is a certain percentage of the fair market value that is determined by local assessors to be the total taxable value of land and additions on the property. | Land | Improvement |
|---|---|---|---|---|
| 2025 | $3,119 | $139,886 | $37,500 | $102,386 |
| 2024 | $3,119 | $139,886 | $37,500 | $102,386 |
| 2023 | $3,332 | $149,748 | $37,500 | $112,248 |
| 2022 | $3,748 | $149,748 | $37,500 | $112,248 |
| 2021 | $3,073 | $117,763 | $32,000 | $85,763 |
| 2020 | $2,986 | $107,763 | $22,000 | $85,763 |
| 2019 | $3,184 | $107,763 | $22,000 | $85,763 |
| 2018 | $2,460 | $83,216 | $20,000 | $63,216 |
| 2017 | $1,920 | $65,224 | $20,000 | $45,224 |
| 2016 | $1,853 | $62,939 | $15,000 | $47,939 |
| 2015 | $1,759 | $62,219 | $15,000 | $47,219 |
| 2014 | $1,759 | $76,965 | $15,000 | $61,965 |
Source: Public Records
Map
Nearby Homes
- 1911 Joslin St
- 1309 Manor Dr
- 1413 Phillips St
- 905 Euclid St
- 1300 Holly St
- 810 Euclid St
- 1315 Grand Ave
- 808 Marengo St
- 902 Turner St
- 805 Marengo St
- 640 W Kilpatrick St
- Robin Plan at Craftsman's Corner
- Cardinal Plan at Craftsman's Corner
- 1401 Old Bridge Rd
- 603 Lilly St
- 1700 Brookhaven St
- 1123 Bales St
- 433 Rose Ave
- Sherwood Plan at Craftsman's Corner
- Essex Plan at Craftsman's Corner
- 1305 Southern Blvd
- 1301 Southern Blvd
- 1307 Southern Blvd
- 1304 Rose Ave
- 1306 Rose Ave
- 1302 Rose Ave
- 1304 Southern Blvd
- 1302 Southern Blvd
- 1306 Southern Blvd
- 1308 Rose Ave
- 1311 Southern Blvd
- 1908 Grand Ave
- 1906 Grand Ave
- 1308 Southern Blvd
- 1910 Grand Ave
- 1904 Grand Ave
- 1315 Southern Blvd
- 1310 Rose Ave
- 1912 Grand Ave
- Tract 2 Farm To Market 4