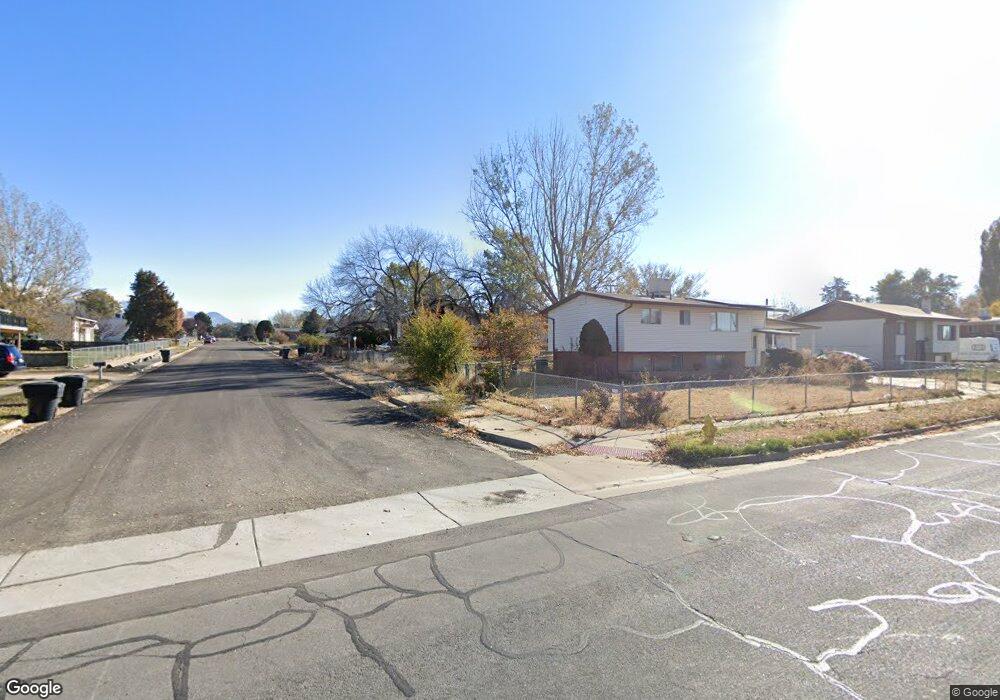
1303 W 2400 N Clearfield, UT 84015
Estimated Value: $786,000 - $846,000
8
Beds
5
Baths
3,044
Sq Ft
$265/Sq Ft
Est. Value
About This Home
This home is located at 1303 W 2400 N, Clearfield, UT 84015 and is currently estimated at $805,502, approximately $264 per square foot. 1303 W 2400 N is a home with nearby schools including Parkside Elementary School, Sunset Junior High School, and Clearfield High School.
Ownership History
Date
Name
Owned For
Owner Type
Purchase Details
Closed on
Dec 30, 2014
Sold by
Castle Creek Homes Llc
Bought by
Vernet Janice C
Current Estimated Value
Home Financials for this Owner
Home Financials are based on the most recent Mortgage that was taken out on this home.
Original Mortgage
$386,362
Outstanding Balance
$295,950
Interest Rate
3.92%
Mortgage Type
Unknown
Estimated Equity
$509,552
Purchase Details
Closed on
Jan 14, 2014
Sold by
Howard Kent Inc
Bought by
Castle Creek Homes Llc
Purchase Details
Closed on
Nov 22, 2011
Sold by
Bre Homestead Llc
Bought by
Benchmark Real Estate Company
Create a Home Valuation Report for This Property
The Home Valuation Report is an in-depth analysis detailing your home's value as well as a comparison with similar homes in the area
Home Values in the Area
Average Home Value in this Area
Purchase History
| Date | Buyer | Sale Price | Title Company |
|---|---|---|---|
| Vernet Janice C | -- | Mountain View Title | |
| Castle Creek Homes Llc | -- | Bonneville Superior Tit | |
| Benchmark Real Estate Company | -- | Accommodation | |
| Howard Kent Inc | -- | Accommodation |
Source: Public Records
Mortgage History
| Date | Status | Borrower | Loan Amount |
|---|---|---|---|
| Open | Vernet Janice C | $386,362 | |
| Closed | Vernet Janice C | $300,540 |
Source: Public Records
Tax History Compared to Growth
Tax History
| Year | Tax Paid | Tax Assessment Tax Assessment Total Assessment is a certain percentage of the fair market value that is determined by local assessors to be the total taxable value of land and additions on the property. | Land | Improvement |
|---|---|---|---|---|
| 2025 | $4,250 | $408,650 | $95,402 | $313,248 |
| 2024 | $4,199 | $405,900 | $104,335 | $301,565 |
| 2023 | $3,897 | $697,000 | $119,641 | $577,359 |
| 2022 | $4,047 | $400,400 | $72,048 | $328,352 |
| 2021 | $3,843 | $564,000 | $92,123 | $471,877 |
| 2020 | $3,360 | $488,000 | $79,316 | $408,684 |
| 2019 | $3,221 | $457,000 | $90,770 | $366,230 |
| 2018 | $3,013 | $420,000 | $76,421 | $343,579 |
| 2016 | $2,916 | $209,935 | $29,973 | $179,962 |
| 2015 | $796 | $54,497 | $54,497 | $0 |
| 2014 | $784 | $54,497 | $54,497 | $0 |
| 2013 | -- | $48,137 | $48,137 | $0 |
Source: Public Records
Map
Nearby Homes