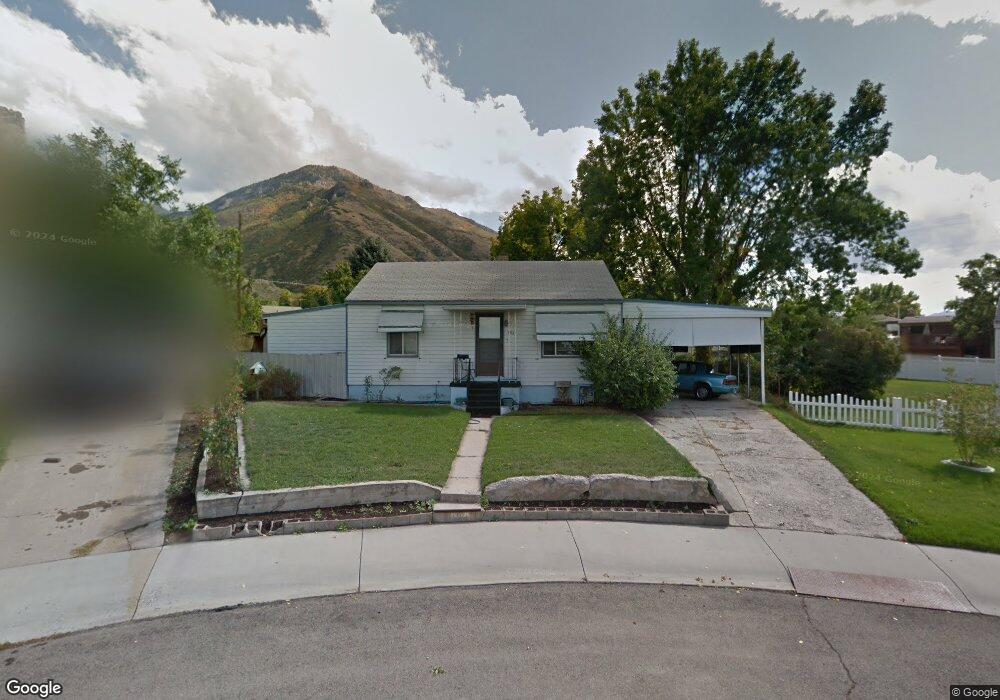
1304 E 520 S Provo, UT 84606
Provost NeighborhoodEstimated Value: $413,000 - $529,000
4
Beds
2
Baths
1,624
Sq Ft
$285/Sq Ft
Est. Value
About This Home
This home is located at 1304 E 520 S, Provo, UT 84606 and is currently estimated at $462,064, approximately $284 per square foot. 1304 E 520 S is a home located in Utah County with nearby schools including Provost School, Centennial Middle School, and Timpview High School.
Ownership History
Date
Name
Owned For
Owner Type
Purchase Details
Closed on
May 24, 2016
Sold by
Bravo Chavez Jose C
Bought by
Bravo Chavez Jose C and Ramirez Adriana
Current Estimated Value
Home Financials for this Owner
Home Financials are based on the most recent Mortgage that was taken out on this home.
Original Mortgage
$137,500
Outstanding Balance
$60,947
Interest Rate
3.66%
Mortgage Type
New Conventional
Estimated Equity
$401,117
Purchase Details
Closed on
May 13, 2015
Sold by
Young Andrew Susan Diane and Young Steven George
Bought by
Truman Marketing Llc
Home Financials for this Owner
Home Financials are based on the most recent Mortgage that was taken out on this home.
Original Mortgage
$133,000
Interest Rate
3.67%
Mortgage Type
Commercial
Purchase Details
Closed on
Aug 15, 2005
Sold by
Young Ruby L and Young Steven G
Bought by
Young Ruby L
Purchase Details
Closed on
Mar 5, 2004
Sold by
Young Ruby L
Bought by
Young Ruby L
Create a Home Valuation Report for This Property
The Home Valuation Report is an in-depth analysis detailing your home's value as well as a comparison with similar homes in the area
Home Values in the Area
Average Home Value in this Area
Purchase History
| Date | Buyer | Sale Price | Title Company |
|---|---|---|---|
| Bravo Chavez Jose C | -- | Accommodation | |
| Bravo Chavez Jose C | -- | Founders Title Co | |
| Truman Marketing Llc | -- | Charger Title | |
| Young Ruby L | -- | -- | |
| Young Ruby L | -- | -- |
Source: Public Records
Mortgage History
| Date | Status | Borrower | Loan Amount |
|---|---|---|---|
| Open | Bravo Chavez Jose C | $137,500 | |
| Closed | Bravo Chavez Jose C | $137,500 | |
| Previous Owner | Truman Marketing Llc | $133,000 |
Source: Public Records
Tax History
| Year | Tax Paid | Tax Assessment Tax Assessment Total Assessment is a certain percentage of the fair market value that is determined by local assessors to be the total taxable value of land and additions on the property. | Land | Improvement |
|---|---|---|---|---|
| 2025 | $2,015 | $219,395 | -- | -- |
| 2024 | $2,015 | $198,330 | $0 | $0 |
| 2023 | $1,991 | $193,160 | $0 | $0 |
| 2022 | $2,208 | $216,040 | $0 | $0 |
| 2021 | $1,640 | $279,800 | $117,300 | $162,500 |
| 2020 | $1,590 | $254,300 | $106,600 | $147,700 |
| 2019 | $1,412 | $235,000 | $106,600 | $128,400 |
| 2018 | $1,261 | $212,800 | $99,000 | $113,800 |
| 2017 | $1,217 | $112,860 | $0 | $0 |
| 2016 | $1,045 | $90,310 | $0 | $0 |
| 2015 | $986 | $86,130 | $0 | $0 |
| 2014 | -- | $80,850 | $0 | $0 |
Source: Public Records
Map
Nearby Homes
Your Personal Tour Guide
Ask me questions while you tour the home.