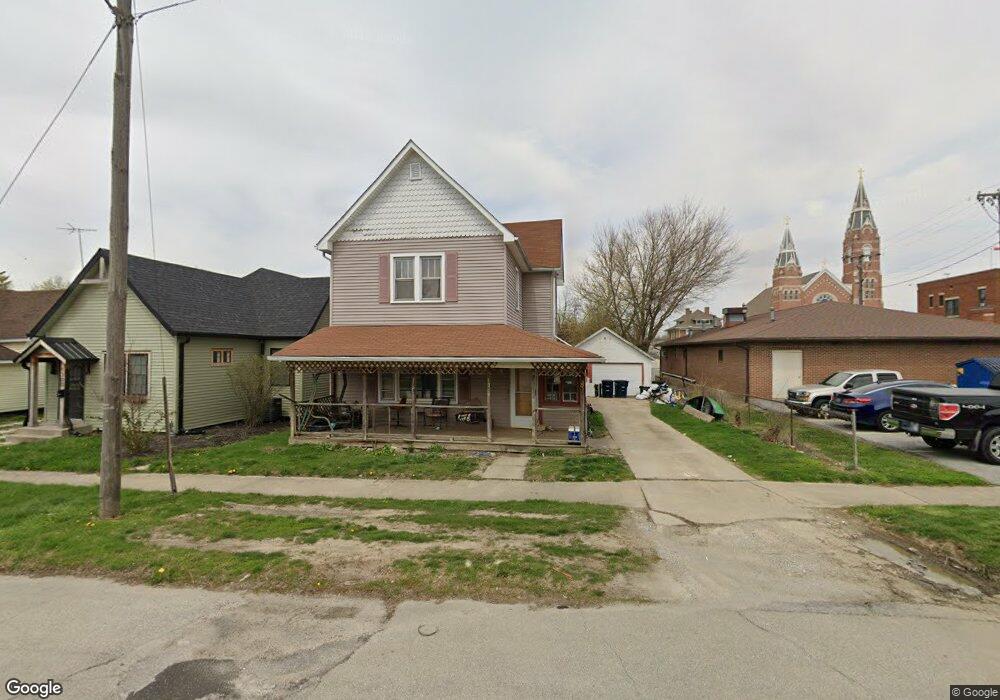
1304 S B St Elwood, IN 46036
Estimated Value: $116,000 - $160,364
4
Beds
1
Bath
2,301
Sq Ft
$59/Sq Ft
Est. Value
About This Home
This home is located at 1304 S B St, Elwood, IN 46036 and is currently estimated at $136,341, approximately $59 per square foot. 1304 S B St is a home located in Madison County with nearby schools including Elwood Elementary School, Elwood Intermediate School, and Elwood Junior-Senior High School.
Ownership History
Date
Name
Owned For
Owner Type
Purchase Details
Closed on
May 10, 2018
Sold by
Harbour Portfolio Viii Lp
Bought by
Wm Capital Partners 68 Llc
Current Estimated Value
Purchase Details
Closed on
Dec 22, 2011
Sold by
Federal National Mortgage Association
Bought by
Harbour Portfolio Vii Lp
Purchase Details
Closed on
Aug 19, 2011
Sold by
Garrett Amy L
Bought by
Fannie Mae
Create a Home Valuation Report for This Property
The Home Valuation Report is an in-depth analysis detailing your home's value as well as a comparison with similar homes in the area
Home Values in the Area
Average Home Value in this Area
Purchase History
| Date | Buyer | Sale Price | Title Company |
|---|---|---|---|
| Wm Capital Partners 68 Llc | -- | None Available | |
| Harbour Portfolio Vii Lp | -- | None Available | |
| Fannie Mae | $76,731 | None Available |
Source: Public Records
Tax History Compared to Growth
Tax History
| Year | Tax Paid | Tax Assessment Tax Assessment Total Assessment is a certain percentage of the fair market value that is determined by local assessors to be the total taxable value of land and additions on the property. | Land | Improvement |
|---|---|---|---|---|
| 2024 | $584 | $58,400 | $10,600 | $47,800 |
| 2023 | $534 | $53,400 | $10,100 | $43,300 |
| 2022 | $539 | $52,900 | $9,600 | $43,300 |
| 2021 | $490 | $49,000 | $9,600 | $39,400 |
| 2020 | $472 | $46,200 | $9,100 | $37,100 |
| 2019 | $461 | $45,100 | $9,100 | $36,000 |
| 2018 | $436 | $42,600 | $9,100 | $33,500 |
| 2017 | $422 | $42,200 | $9,100 | $33,100 |
| 2016 | $432 | $42,200 | $9,100 | $33,100 |
| 2014 | $417 | $41,700 | $9,100 | $32,600 |
| 2013 | $417 | $41,700 | $9,100 | $32,600 |
Source: Public Records
Map
Nearby Homes