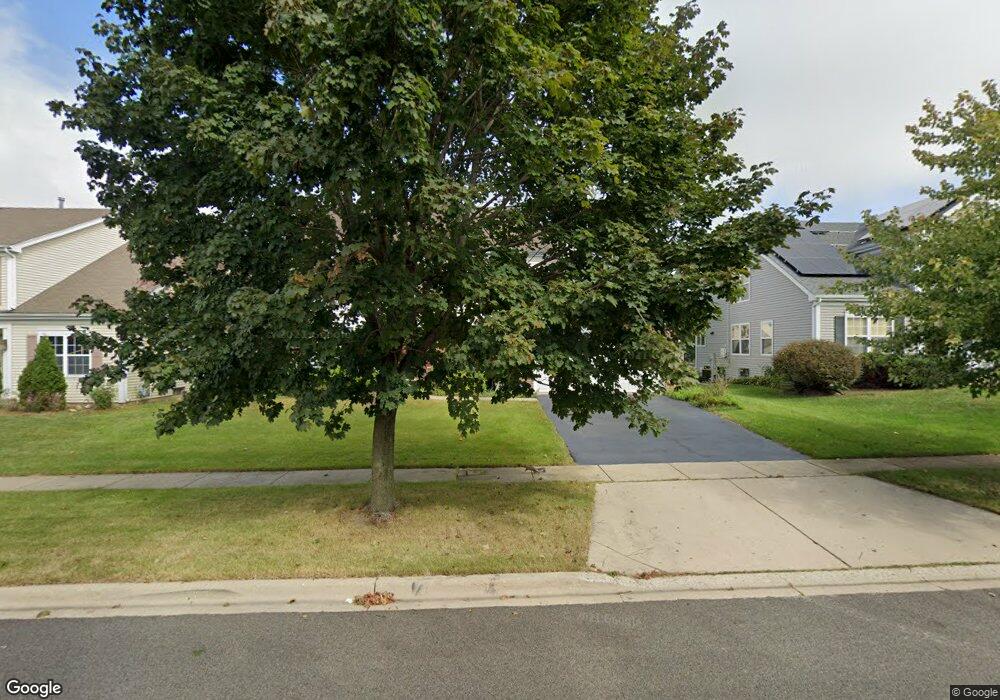
1304 York Dr Carpentersville, IL 60110
Estimated Value: $346,955 - $425,000
4
Beds
--
Bath
2,020
Sq Ft
$192/Sq Ft
Est. Value
About This Home
This home is located at 1304 York Dr, Carpentersville, IL 60110 and is currently estimated at $387,239, approximately $191 per square foot. 1304 York Dr is a home located in Kane County with nearby schools including Sunny Hill Elementary School, Barrington Middle School Station Campus, and Barrington High School.
Ownership History
Date
Name
Owned For
Owner Type
Purchase Details
Closed on
Jul 25, 2020
Sold by
Ali Mohammad Sikander and Ali Tasneem Sultana
Bought by
Ali Mohammad Sikander and Ali Tasneem Sultana
Current Estimated Value
Purchase Details
Closed on
Mar 16, 2001
Sold by
Frost Walter R
Bought by
Ali Mohammad S and Ali Tasneem Sultana
Home Financials for this Owner
Home Financials are based on the most recent Mortgage that was taken out on this home.
Original Mortgage
$161,600
Interest Rate
7.02%
Purchase Details
Closed on
Jun 22, 1995
Sold by
Kennedy Group Ltd Partnership
Bought by
Frost Walter R
Home Financials for this Owner
Home Financials are based on the most recent Mortgage that was taken out on this home.
Original Mortgage
$108,000
Interest Rate
7.9%
Create a Home Valuation Report for This Property
The Home Valuation Report is an in-depth analysis detailing your home's value as well as a comparison with similar homes in the area
Home Values in the Area
Average Home Value in this Area
Purchase History
| Date | Buyer | Sale Price | Title Company |
|---|---|---|---|
| Ali Mohammad Sikander | -- | None Available | |
| Ali Mohammad S | $202,000 | -- | |
| Frost Walter R | $168,500 | Chicago Title Insurance Co |
Source: Public Records
Mortgage History
| Date | Status | Borrower | Loan Amount |
|---|---|---|---|
| Previous Owner | Ali Mohammad S | $161,600 | |
| Previous Owner | Frost Walter R | $108,000 |
Source: Public Records
Tax History Compared to Growth
Tax History
| Year | Tax Paid | Tax Assessment Tax Assessment Total Assessment is a certain percentage of the fair market value that is determined by local assessors to be the total taxable value of land and additions on the property. | Land | Improvement |
|---|---|---|---|---|
| 2024 | $7,899 | $109,515 | $24,205 | $85,310 |
| 2023 | $7,538 | $98,538 | $21,779 | $76,759 |
| 2022 | $7,486 | $92,614 | $21,779 | $70,835 |
| 2021 | $7,198 | $87,446 | $20,564 | $66,882 |
| 2020 | $6,840 | $85,480 | $20,102 | $65,378 |
| 2019 | $6,460 | $81,147 | $19,083 | $62,064 |
| 2018 | $6,076 | $73,896 | $18,705 | $55,191 |
| 2017 | $5,647 | $69,127 | $17,498 | $51,629 |
| 2016 | $5,193 | $61,233 | $16,942 | $44,291 |
| 2015 | -- | $56,540 | $19,724 | $36,816 |
| 2014 | -- | $54,978 | $19,179 | $35,799 |
| 2013 | -- | $56,661 | $19,766 | $36,895 |
Source: Public Records
Map
Nearby Homes