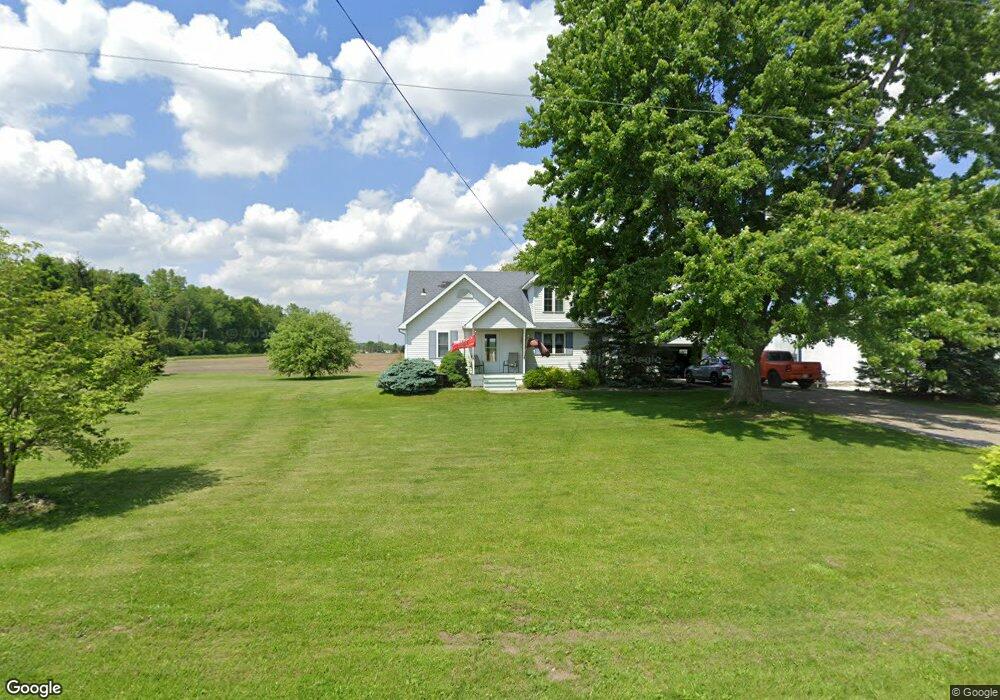
13040 Perry Rd Grand Rapids, OH 43522
West Lucas County NeighborhoodEstimated Value: $300,000 - $498,000
3
Beds
2
Baths
1,650
Sq Ft
$234/Sq Ft
Est. Value
About This Home
This home is located at 13040 Perry Rd, Grand Rapids, OH 43522 and is currently estimated at $386,890, approximately $234 per square foot. 13040 Perry Rd is a home located in Lucas County with nearby schools including Otsego Elementary School, Otsego Junior High School, and Otsego High School.
Ownership History
Date
Name
Owned For
Owner Type
Purchase Details
Closed on
Oct 21, 2016
Sold by
Fleming Tony K and Fleming Deann R
Bought by
Vanbarg Michael
Current Estimated Value
Home Financials for this Owner
Home Financials are based on the most recent Mortgage that was taken out on this home.
Original Mortgage
$173,737
Outstanding Balance
$139,371
Interest Rate
3.48%
Mortgage Type
New Conventional
Estimated Equity
$247,519
Purchase Details
Closed on
Sep 9, 1993
Sold by
Winner Chad R and Winner Anjanette
Purchase Details
Closed on
Aug 5, 1991
Sold by
Krohn Burdette and Krohn Clarissa#
Purchase Details
Closed on
Dec 18, 1989
Sold by
Krohn Burdette and Krohn Clarissa*
Create a Home Valuation Report for This Property
The Home Valuation Report is an in-depth analysis detailing your home's value as well as a comparison with similar homes in the area
Home Values in the Area
Average Home Value in this Area
Purchase History
| Date | Buyer | Sale Price | Title Company |
|---|---|---|---|
| Vanbarg Michael | $172,000 | Louisville Title Agency | |
| -- | $72,000 | -- | |
| -- | $65,000 | -- | |
| -- | -- | -- |
Source: Public Records
Mortgage History
| Date | Status | Borrower | Loan Amount |
|---|---|---|---|
| Open | Vanbarg Michael | $173,737 |
Source: Public Records
Tax History Compared to Growth
Tax History
| Year | Tax Paid | Tax Assessment Tax Assessment Total Assessment is a certain percentage of the fair market value that is determined by local assessors to be the total taxable value of land and additions on the property. | Land | Improvement |
|---|---|---|---|---|
| 2024 | $2,949 | $124,600 | $17,115 | $107,485 |
| 2023 | $2,717 | $54,075 | $9,730 | $44,345 |
| 2022 | $2,752 | $54,075 | $9,730 | $44,345 |
| 2021 | $2,753 | $54,075 | $9,730 | $44,345 |
| 2020 | $2,366 | $43,715 | $7,805 | $35,910 |
| 2019 | $2,308 | $43,715 | $7,805 | $35,910 |
| 2018 | $2,035 | $43,715 | $7,805 | $35,910 |
| 2017 | $1,903 | $37,065 | $6,615 | $30,450 |
| 2016 | $1,873 | $105,900 | $18,900 | $87,000 |
| 2015 | $1,887 | $105,900 | $18,900 | $87,000 |
| 2014 | $1,934 | $36,340 | $6,480 | $29,860 |
| 2013 | $1,934 | $36,340 | $6,480 | $29,860 |
Source: Public Records
Map
Nearby Homes
- 9100 Prov Neap Swan Rd
- 14060 Harrison Rd
- U344 County Road 2
- U266 County Road 2
- 12200 S River Rd
- 14121 Hite Rd
- 0 Manore Lot A Rd Unit 6130402
- 0 Manore Lot B Rd Unit 6130403
- 10855 S River Rd
- 11500 Stiles Rd
- 12036 Archbold Whitehouse Rd
- 23763 Front St
- 23912 E 2nd St
- 11171 Whitetail Way
- 3101 County Road 1
- 7018 Red Stag Ct
- 17645 Sycamore Rd
- 11159 Whitetail Way
- 6952 Red Stag Ct
- 11158 Whitetail Way
- 12940 Perry Rd
- 13210 Perry Rd
- 13233 Perry Rd
- 12833 Perry Rd
- 9740 Jeffers Rd
- 12830 Perry Rd
- 9300 Jeffers Rd
- 9305 Jeffers Rd
- 13301 Perry Rd
- 13344 Perry Rd
- 9909 Jeffers Rd
- 9925 Jeffers Rd
- 12910 Bailey Rd
- 9935 Jeffers Rd
- 13020 Bailey Rd
- 13008 Bailey Rd
- 9655 Yawberg Rd
- 9651 Manore Rd
- 12940 Bailey Rd
- 13102 Neowash Rd