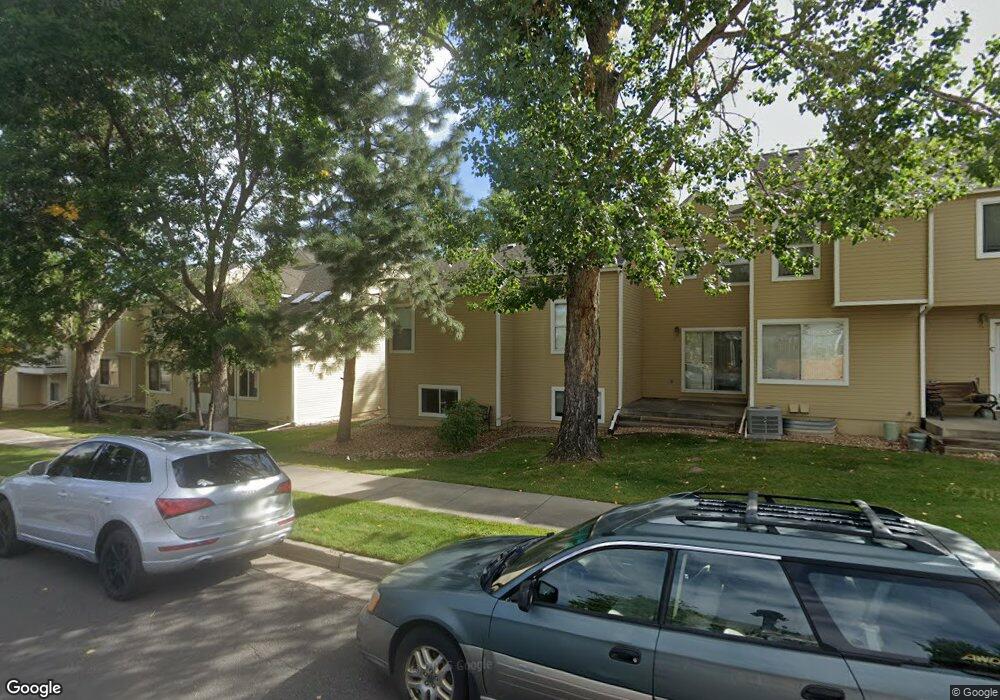
13045 W 63rd Place Unit D Arvada, CO 80004
Ralston Valley NeighborhoodEstimated Value: $393,094 - $434,000
2
Beds
2
Baths
1,040
Sq Ft
$394/Sq Ft
Est. Value
About This Home
This home is located at 13045 W 63rd Place Unit D, Arvada, CO 80004 and is currently estimated at $409,274, approximately $393 per square foot. 13045 W 63rd Place Unit D is a home located in Jefferson County with nearby schools including Vanderhoof Elementary School, Drake Junior High School, and Arvada West High School.
Ownership History
Date
Name
Owned For
Owner Type
Purchase Details
Closed on
Jun 4, 2004
Sold by
Bass Tyler
Bought by
Dutton Randy L
Current Estimated Value
Home Financials for this Owner
Home Financials are based on the most recent Mortgage that was taken out on this home.
Original Mortgage
$94,000
Outstanding Balance
$45,858
Interest Rate
5.97%
Mortgage Type
Unknown
Estimated Equity
$363,416
Purchase Details
Closed on
Mar 15, 2002
Sold by
Hooper Mark D
Bought by
Bass Tyler
Purchase Details
Closed on
Jan 30, 1996
Sold by
Meadowlake Ltd Liability Company
Bought by
Hooper Mark D
Home Financials for this Owner
Home Financials are based on the most recent Mortgage that was taken out on this home.
Original Mortgage
$87,000
Interest Rate
7.08%
Create a Home Valuation Report for This Property
The Home Valuation Report is an in-depth analysis detailing your home's value as well as a comparison with similar homes in the area
Home Values in the Area
Average Home Value in this Area
Purchase History
| Date | Buyer | Sale Price | Title Company |
|---|---|---|---|
| Dutton Randy L | $171,000 | Fahtco | |
| Bass Tyler | $172,000 | -- | |
| Hooper Mark D | $108,835 | -- |
Source: Public Records
Mortgage History
| Date | Status | Borrower | Loan Amount |
|---|---|---|---|
| Open | Dutton Randy L | $94,000 | |
| Previous Owner | Hooper Mark D | $87,000 |
Source: Public Records
Tax History Compared to Growth
Tax History
| Year | Tax Paid | Tax Assessment Tax Assessment Total Assessment is a certain percentage of the fair market value that is determined by local assessors to be the total taxable value of land and additions on the property. | Land | Improvement |
|---|---|---|---|---|
| 2024 | $1,475 | $21,911 | $6,030 | $15,881 |
| 2023 | $1,475 | $21,911 | $6,030 | $15,881 |
| 2022 | $1,404 | $21,288 | $4,170 | $17,118 |
| 2021 | $1,427 | $21,901 | $4,290 | $17,611 |
| 2020 | $2,014 | $20,866 | $4,290 | $16,576 |
| 2019 | $1,986 | $20,866 | $4,290 | $16,576 |
| 2018 | $1,553 | $15,862 | $3,600 | $12,262 |
| 2017 | $1,422 | $15,862 | $3,600 | $12,262 |
| 2016 | $1,400 | $14,718 | $2,706 | $12,012 |
| 2015 | $1,122 | $14,718 | $2,706 | $12,012 |
| 2014 | $1,122 | $11,081 | $2,229 | $8,852 |
Source: Public Records
Map
Nearby Homes
- 13155 W 63rd Place
- 13096 W 62nd Dr
- 6416 Zang Ct
- 12924 W 64th Dr Unit B
- 13245 W 63rd Cir
- 13275 W 63rd Place
- 6414 Zinnia St
- 13168 W 62nd Dr
- 6440 Wright St
- 12976 W 61st Cir
- 6411 Welch Ct
- 12912 W 61st Cir
- 6544 Alkire Ct
- 6332 Coors Ln
- 13432 W 65th Place
- 6615 Zang St
- 13618 W 62nd Dr
- 6616 Zang Cir
- 6312 Deframe Way
- 6003 Yank Ct
- 13045 W 63rd Place Unit A
- 13045 W 63rd Place Unit B
- 13045 W 63rd Place Unit C
- 13045 W 63rd Place Unit E
- 13045 W 63rd Place
- 6373 Zang Ct Unit D
- 6373 Zang Ct Unit C
- 6373 Zang Ct Unit B
- 6373 Zang Ct Unit A
- 6373 Zang Ct Unit B
- 6352 Zang Ct Unit A
- 6352 Zang Ct Unit B
- 6352 Zang Ct Unit C
- 6352 Zang Ct Unit D
- 6352 Zang Ct Unit E
- 13025 W 63rd Place Unit E
- 13025 W 63rd Place Unit D
- 13025 W 63rd Place Unit B
- 13025 W 63rd Place Unit A
- 13025 W 63rd Place