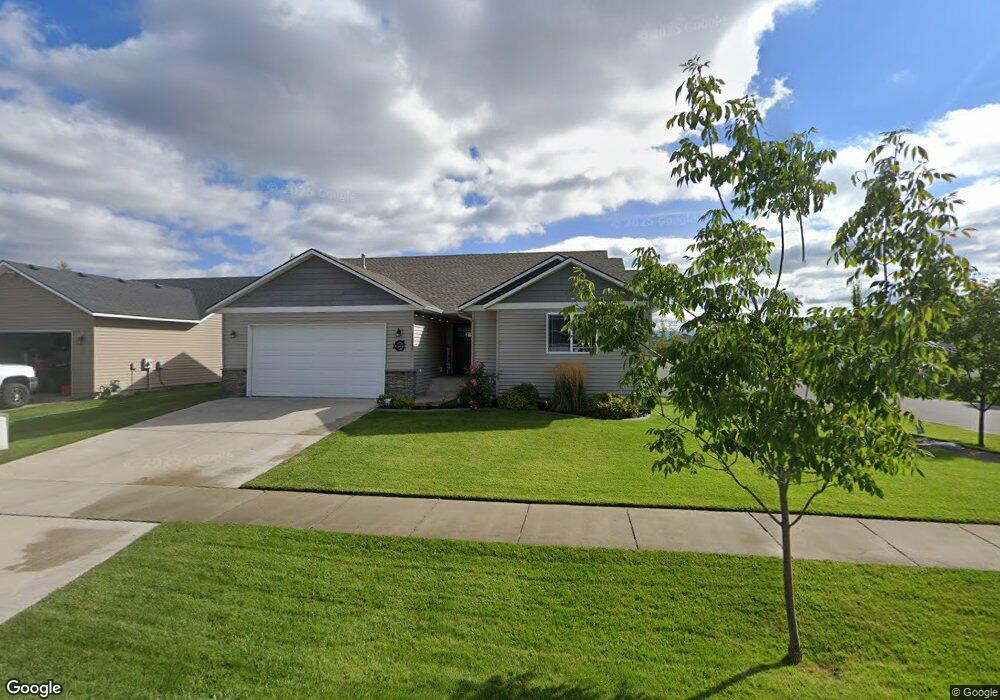
13048 N Reward Loop Rathdrum, ID 83858
Estimated Value: $471,795 - $534,000
3
Beds
2
Baths
1,551
Sq Ft
$319/Sq Ft
Est. Value
About This Home
This home is located at 13048 N Reward Loop, Rathdrum, ID 83858 and is currently estimated at $495,199, approximately $319 per square foot. 13048 N Reward Loop is a home located in Kootenai County with nearby schools including Betty Kiefer Elementary School, Lakeland Middle School, and Lakeland Senior High School.
Ownership History
Date
Name
Owned For
Owner Type
Purchase Details
Closed on
Jun 19, 2019
Sold by
Pruitt Bryce
Bought by
Casey Kyle and Casey Lauren
Current Estimated Value
Home Financials for this Owner
Home Financials are based on the most recent Mortgage that was taken out on this home.
Original Mortgage
$286,711
Outstanding Balance
$250,277
Interest Rate
3.75%
Mortgage Type
FHA
Estimated Equity
$244,922
Purchase Details
Closed on
May 17, 2016
Sold by
Benway Quality Homes Inc
Bought by
Pruitt Bryce
Home Financials for this Owner
Home Financials are based on the most recent Mortgage that was taken out on this home.
Original Mortgage
$202,160
Interest Rate
3.59%
Mortgage Type
New Conventional
Purchase Details
Closed on
Aug 28, 2015
Sold by
Prairie Sky Investments Llc
Bought by
Benway Quality Homes Inc
Create a Home Valuation Report for This Property
The Home Valuation Report is an in-depth analysis detailing your home's value as well as a comparison with similar homes in the area
Home Values in the Area
Average Home Value in this Area
Purchase History
| Date | Buyer | Sale Price | Title Company |
|---|---|---|---|
| Casey Kyle | -- | First American Ttl Kootenai | |
| Pruitt Bryce | -- | First American Title Kootena | |
| Benway Quality Homes Inc | -- | First American Title Company |
Source: Public Records
Mortgage History
| Date | Status | Borrower | Loan Amount |
|---|---|---|---|
| Open | Casey Kyle | $286,711 | |
| Previous Owner | Pruitt Bryce | $202,160 |
Source: Public Records
Tax History
| Year | Tax Paid | Tax Assessment Tax Assessment Total Assessment is a certain percentage of the fair market value that is determined by local assessors to be the total taxable value of land and additions on the property. | Land | Improvement |
|---|---|---|---|---|
| 2025 | $1,648 | $438,930 | $175,000 | $263,930 |
| 2024 | $1,722 | $431,467 | $160,000 | $271,467 |
| 2023 | $1,722 | $459,394 | $175,000 | $284,394 |
| 2022 | $2,224 | $485,248 | $175,000 | $310,248 |
| 2021 | $2,035 | $315,122 | $104,791 | $210,331 |
| 2020 | $1,941 | $268,433 | $91,123 | $177,310 |
| 2019 | $2,072 | $247,575 | $75,936 | $171,639 |
| 2018 | $1,911 | $218,011 | $66,031 | $151,980 |
| 2017 | $3,458 | $202,701 | $54,571 | $148,130 |
| 2016 | $805 | $0 | $0 | $0 |
| 2015 | $321 | $30,750 | $30,750 | $0 |
| 2013 | -- | $28,688 | $28,688 | $0 |
Source: Public Records
Map
Nearby Homes
- 6637 W Rambo St
- 6810 W Soldier Creek Ave
- 6494 W Buffalo Grass Ln
- 12981 Gondola
- 13421 N Shimmering Ct
- 13439 N Shimmering Ct
- 7463 W Lancaster Rd
- 5994 W Alliance St
- 12503 N Farley Way
- 15079 N Pristine Cir
- 6456 W Irish Cir
- 15136 N Pristine Cir
- 14071 N Pristine Cir
- 15465 N Pristine Cir
- 0 Nagel St
- 12692 N Lattner St
- 11890 N Entwistle Way
- 6768 W Daltrey Way
- 12750 N Cavanaugh Dr
- 6697 W Irish Cir
- 13072 N Reward Loop
- 13072 N Reward Loop
- 13043 N Zodiac Loop
- 13043 N Zodiac Loop
- 13090 N Reward Loop
- 6719 Harmony
- 6719 W Harmony St
- 13045 N Reward Loop
- 13073 N Reward Loop
- 6718 Harmony
- 13065 N Zodiac Loop
- 6718 W Harmony St
- 6684 Conner
- 13100 N Reward Loop
- 6689 Harmony
- 6714 W Conner St
- 13048 N Zodiac Loop
- 13048 N Zodiac Loop
- 13115 N Reward Loop
- 6689 W Harmony St
Your Personal Tour Guide
Ask me questions while you tour the home.