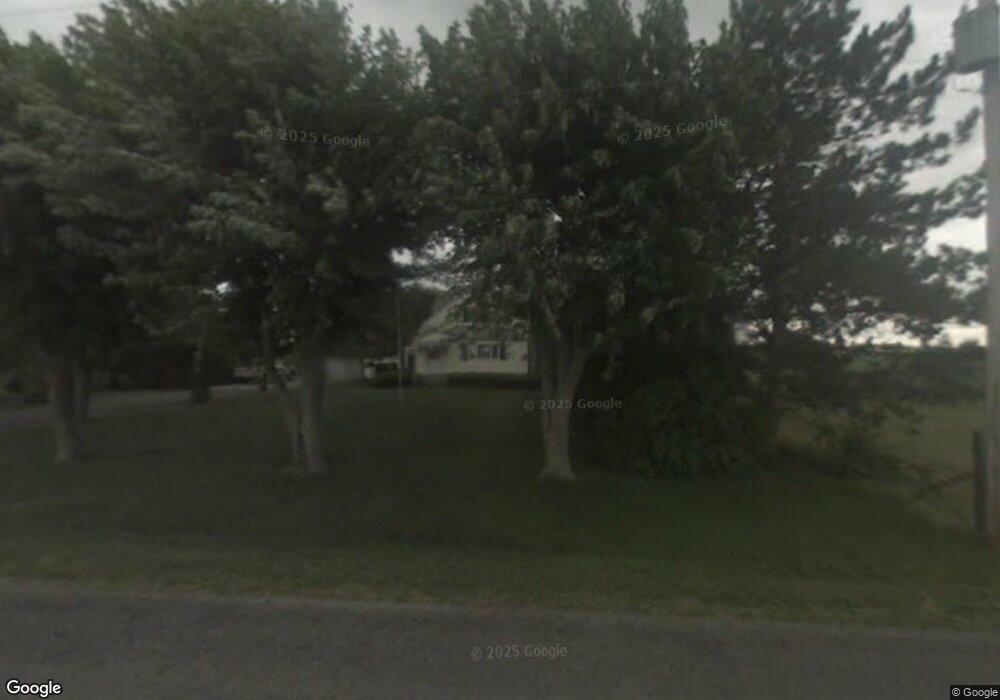
13049 Landeck Rd Delphos, OH 45833
Estimated Value: $194,250 - $239,000
4
Beds
2
Baths
1,954
Sq Ft
$106/Sq Ft
Est. Value
About This Home
This home is located at 13049 Landeck Rd, Delphos, OH 45833 and is currently estimated at $207,063, approximately $105 per square foot. 13049 Landeck Rd is a home located in Allen County.
Ownership History
Date
Name
Owned For
Owner Type
Purchase Details
Closed on
Aug 21, 2020
Sold by
Bohyer Tonya L and Haunhorst Jay R
Bought by
Haunhorst Caleb E
Current Estimated Value
Home Financials for this Owner
Home Financials are based on the most recent Mortgage that was taken out on this home.
Original Mortgage
$96,000
Outstanding Balance
$85,159
Interest Rate
3%
Mortgage Type
Unknown
Estimated Equity
$121,904
Purchase Details
Closed on
Mar 21, 1991
Bought by
Haunhorst Bertha E
Create a Home Valuation Report for This Property
The Home Valuation Report is an in-depth analysis detailing your home's value as well as a comparison with similar homes in the area
Home Values in the Area
Average Home Value in this Area
Purchase History
| Date | Buyer | Sale Price | Title Company |
|---|---|---|---|
| Haunhorst Caleb E | $120,000 | None Available | |
| Haunhorst Bertha E | -- | -- |
Source: Public Records
Mortgage History
| Date | Status | Borrower | Loan Amount |
|---|---|---|---|
| Open | Haunhorst Caleb E | $96,000 |
Source: Public Records
Tax History Compared to Growth
Tax History
| Year | Tax Paid | Tax Assessment Tax Assessment Total Assessment is a certain percentage of the fair market value that is determined by local assessors to be the total taxable value of land and additions on the property. | Land | Improvement |
|---|---|---|---|---|
| 2024 | $1,681 | $54,500 | $27,090 | $27,410 |
| 2023 | $1,391 | $42,250 | $21,000 | $21,250 |
| 2022 | $1,421 | $42,250 | $21,000 | $21,250 |
| 2021 | $1,783 | $53,130 | $21,420 | $31,710 |
| 2020 | $1,368 | $51,100 | $23,240 | $27,860 |
| 2019 | $1,368 | $51,100 | $23,240 | $27,860 |
| 2018 | $1,290 | $51,100 | $23,240 | $27,860 |
| 2017 | $1,211 | $46,060 | $20,720 | $25,340 |
| 2016 | $1,215 | $46,060 | $20,720 | $25,340 |
| 2015 | $1,182 | $46,060 | $20,720 | $25,340 |
| 2014 | $1,122 | $42,780 | $19,080 | $23,700 |
| 2013 | $1,128 | $42,780 | $19,080 | $23,700 |
Source: Public Records
Map
Nearby Homes
- 4455 N Kill Rd
- 1400 S Clay St Unit 17
- 1001 S Adams St
- 827 S Washington St
- 11630 Clearview Dr
- 634 S Clay St
- 516 S Main St
- 483 S Franklin St
- 424 S Canal St
- 221 S Main St
- 409 N Bredeick St
- 210 E 3rd St
- 633 E 2nd St
- 7110 Elida Rd
- 405 N Franklin St
- 604 W 6th St
- 610 N Washington St
- 704 N Franklin St
- 521 Carolyn Dr
- 810 N Franklin St
- 4477 Southworth Rd
- 4545 Southworth Rd
- 4477 Acadia Rd
- 4590 Southworth Rd
- 4334 Southworth Rd
- 4241 Southworth Rd
- 4305 Acadia Rd
- 4111 Southworth Rd
- 4150 Acadia Rd
- 12626 Landeck Rd
- 13460 Landeck Rd
- 12580 Landeck Rd
- 3464 Southworth Rd
- 4835 Acadia Rd
- 12538 Landeck Rd
- 4825 Southworth Rd
- 4820 Southworth Rd
- 13526 Landeck Rd
- 4050 Acadia Rd