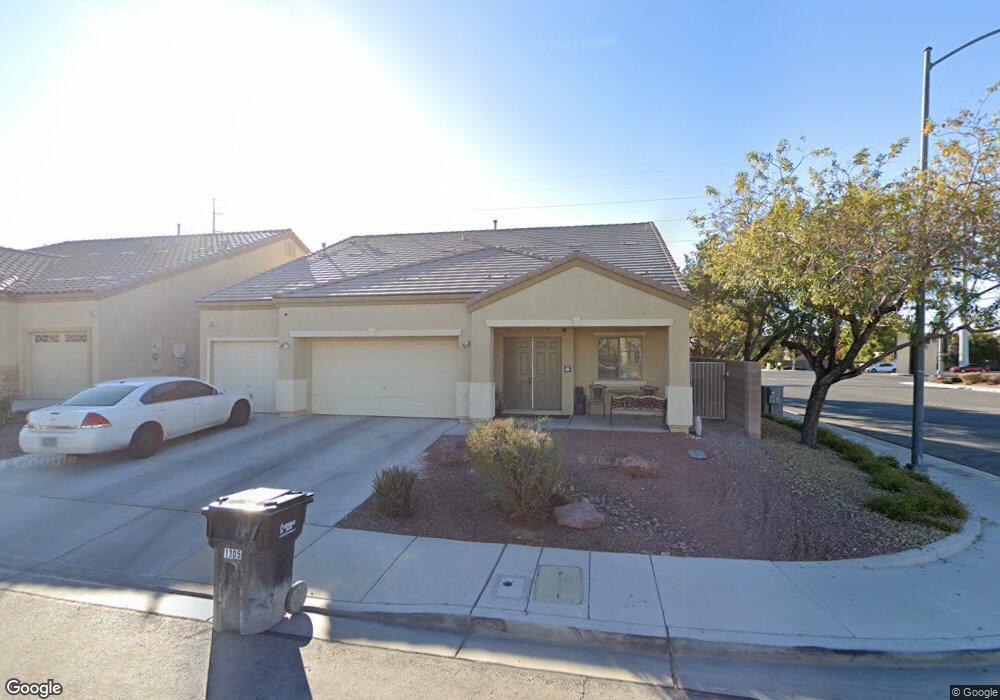
1305 Andrew David Ave North Las Vegas, NV 89086
Deer Springs NeighborhoodEstimated Value: $493,992 - $519,000
3
Beds
3
Baths
2,751
Sq Ft
$183/Sq Ft
Est. Value
About This Home
This home is located at 1305 Andrew David Ave, North Las Vegas, NV 89086 and is currently estimated at $503,248, approximately $182 per square foot. 1305 Andrew David Ave is a home located in Clark County with nearby schools including Don E. Hayden Elementary School, Ruby Duncan Elementary School, and Carroll M. Johnston STEM Academy of Environmental Studies.
Ownership History
Date
Name
Owned For
Owner Type
Purchase Details
Closed on
Aug 29, 2022
Sold by
Ards Earlonda F
Bought by
Ards Earlonda F
Current Estimated Value
Home Financials for this Owner
Home Financials are based on the most recent Mortgage that was taken out on this home.
Original Mortgage
$216,727
Outstanding Balance
$207,465
Interest Rate
5.5%
Mortgage Type
FHA
Estimated Equity
$295,783
Purchase Details
Closed on
May 3, 2010
Sold by
Quinones Oscar and Quinones Merita Alcaraz
Bought by
Amos Earlonda F
Home Financials for this Owner
Home Financials are based on the most recent Mortgage that was taken out on this home.
Original Mortgage
$124,029
Interest Rate
5.5%
Mortgage Type
FHA
Purchase Details
Closed on
Jun 26, 2007
Sold by
Centex Homes
Bought by
Quinones Oscar and Quinones Merita Alcaraz
Home Financials for this Owner
Home Financials are based on the most recent Mortgage that was taken out on this home.
Original Mortgage
$374,603
Interest Rate
8.55%
Mortgage Type
Unknown
Create a Home Valuation Report for This Property
The Home Valuation Report is an in-depth analysis detailing your home's value as well as a comparison with similar homes in the area
Home Values in the Area
Average Home Value in this Area
Purchase History
| Date | Buyer | Sale Price | Title Company |
|---|---|---|---|
| Ards Earlonda F | -- | -- | |
| Amos Earlonda F | $140,000 | North American Title Sahara | |
| Quinones Oscar | $374,603 | Commerce Title |
Source: Public Records
Mortgage History
| Date | Status | Borrower | Loan Amount |
|---|---|---|---|
| Open | Ards Earlonda F | $216,727 | |
| Previous Owner | Amos Earlonda F | $124,029 | |
| Previous Owner | Quinones Oscar | $374,603 |
Source: Public Records
Tax History Compared to Growth
Tax History
| Year | Tax Paid | Tax Assessment Tax Assessment Total Assessment is a certain percentage of the fair market value that is determined by local assessors to be the total taxable value of land and additions on the property. | Land | Improvement |
|---|---|---|---|---|
| 2025 | $2,186 | $153,556 | $36,750 | $116,806 |
| 2024 | $2,123 | $153,556 | $36,750 | $116,806 |
| 2023 | $2,123 | $144,139 | $34,300 | $109,839 |
| 2022 | $2,061 | $127,728 | $27,650 | $100,078 |
| 2021 | $2,001 | $115,006 | $25,900 | $89,106 |
| 2020 | $1,940 | $112,309 | $25,200 | $87,109 |
| 2019 | $1,883 | $101,140 | $21,000 | $80,140 |
| 2018 | $1,829 | $89,794 | $18,550 | $71,244 |
| 2017 | $2,797 | $83,386 | $15,750 | $67,636 |
| 2016 | $1,732 | $68,084 | $12,600 | $55,484 |
| 2015 | $1,728 | $55,397 | $9,450 | $45,947 |
| 2014 | $1,678 | $48,526 | $7,700 | $40,826 |
Source: Public Records
Map
Nearby Homes
- 6338 Black Mane Way
- 1156 Appaloosa Hills Ave
- 1231 Appaloosa Hills Ave
- 6512 N Bruce St
- 1213 Bistro Bay Ave Unit 3
- 1409 Palomino Farm Way
- 6424 Amanda Michelle Ln
- 6243 Black Mane Way
- 6242 Standing Elm St
- 1008 Oceanwood Ave
- 1713 Palomino Farm Way
- 6504 N Austin Moore St
- 1805 Palomino Farm Way Unit 3
- 6425 Sierra Sands St
- 1023 Sunny Acres Ave
- 2014 Millergrove Ave
- 1804 Jake Andrew Ave
- 1509 Peyton Stewart Ct
- 6446 Silver Estates St
- 916 Echo Beach Ave
- 1309 Andrew David Ave
- 1405 Andrew David Ave
- 1304 Andrew David Ave
- 6404 Starling Mesa St
- 1308 Andrew David Ave Unit 1A
- 6408 Starling Mesa St
- 1312 Andrew David Ave
- 6412R Starling Mesa St
- 1409 Andrew David Ave
- 1404 Andrew David Ave
- 1217 Malibu Sands Ave Unit 1
- 6416 Starling Mesa St Unit 1
- 1408 Andrew David Ave
- 1413 Andrew David Ave
- 6420 Starling Mesa St Unit 2
- 6341 Black Mane Way
- 6441 Jonah Clarke St
- 6424 N Starling Mesa St
- 1412 Andrew David Ave
- 6424 Starling Mesa St