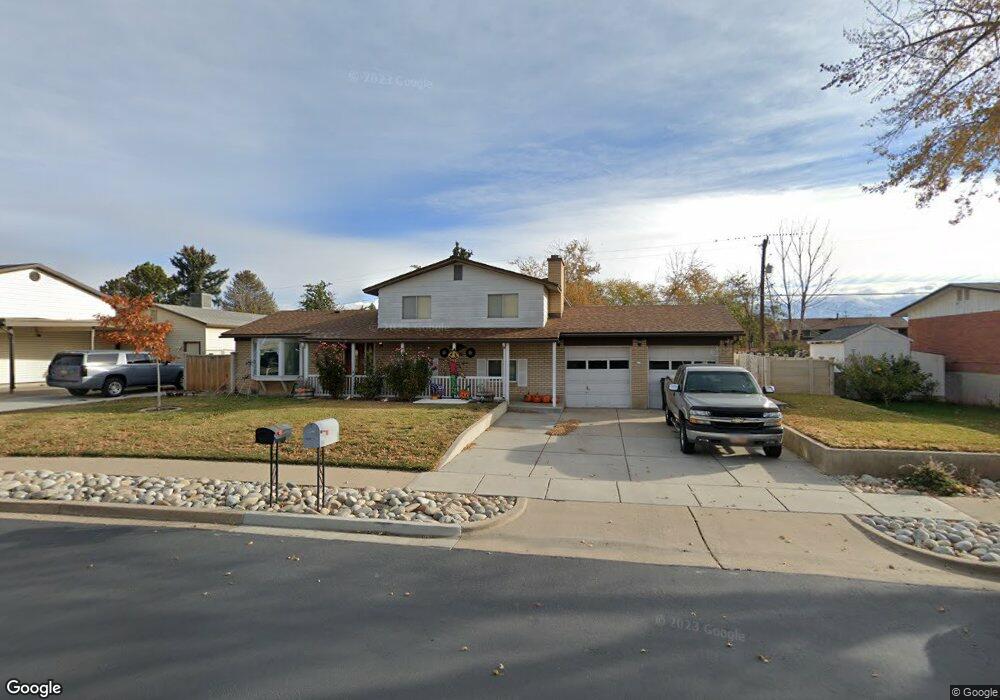
1305 Ann St Syracuse, UT 84075
Estimated Value: $395,000 - $427,476
2
Beds
2
Baths
1,850
Sq Ft
$225/Sq Ft
Est. Value
About This Home
This home is located at 1305 Ann St, Syracuse, UT 84075 and is currently estimated at $415,869, approximately $224 per square foot. 1305 Ann St is a home located in Davis County with nearby schools including Cook School, Syracuse Junior High School, and Syracuse High School.
Ownership History
Date
Name
Owned For
Owner Type
Purchase Details
Closed on
Jan 30, 2013
Sold by
Barker Shyla S
Bought by
Barker Logan S and Barker Shayla S
Current Estimated Value
Home Financials for this Owner
Home Financials are based on the most recent Mortgage that was taken out on this home.
Original Mortgage
$121,735
Outstanding Balance
$62,603
Interest Rate
3.33%
Mortgage Type
New Conventional
Estimated Equity
$353,266
Purchase Details
Closed on
Mar 2, 2011
Sold by
Wheeler Leo L and Wheeler Glenda L
Bought by
Wheeler Leo L and Wheeler Glenda L
Home Financials for this Owner
Home Financials are based on the most recent Mortgage that was taken out on this home.
Original Mortgage
$80,000
Interest Rate
4.71%
Mortgage Type
New Conventional
Purchase Details
Closed on
Dec 17, 1998
Sold by
Wheeler Leo L and Wheeler Glenda L
Bought by
Wheeler Leo L and Wheeler Glenda L
Create a Home Valuation Report for This Property
The Home Valuation Report is an in-depth analysis detailing your home's value as well as a comparison with similar homes in the area
Home Values in the Area
Average Home Value in this Area
Purchase History
| Date | Buyer | Sale Price | Title Company |
|---|---|---|---|
| Barker Logan S | -- | Accommodation | |
| Barker Shayla S | -- | First American Title Company | |
| Wheeler Leo L | -- | None Available | |
| Wheeler Leo L | -- | -- |
Source: Public Records
Mortgage History
| Date | Status | Borrower | Loan Amount |
|---|---|---|---|
| Open | Barker Shayla S | $121,735 | |
| Previous Owner | Wheeler Leo L | $80,000 |
Source: Public Records
Tax History
| Year | Tax Paid | Tax Assessment Tax Assessment Total Assessment is a certain percentage of the fair market value that is determined by local assessors to be the total taxable value of land and additions on the property. | Land | Improvement |
|---|---|---|---|---|
| 2025 | $2,275 | $219,450 | $123,707 | $95,743 |
| 2024 | $2,203 | $213,950 | $101,129 | $112,821 |
| 2023 | $2,051 | $363,000 | $140,978 | $222,022 |
| 2022 | $2,177 | $211,200 | $81,315 | $129,885 |
| 2021 | $2,024 | $304,000 | $120,031 | $183,969 |
| 2020 | $1,767 | $257,000 | $105,154 | $151,846 |
| 2019 | $1,623 | $233,000 | $102,057 | $130,943 |
| 2018 | $1,446 | $206,000 | $98,955 | $107,045 |
| 2016 | $1,240 | $92,675 | $38,008 | $54,667 |
| 2015 | $1,197 | $85,195 | $38,008 | $47,187 |
| 2014 | $1,186 | $86,030 | $38,008 | $48,022 |
| 2013 | -- | $77,884 | $28,435 | $49,449 |
Source: Public Records
Map
Nearby Homes
Your Personal Tour Guide
Ask me questions while you tour the home.