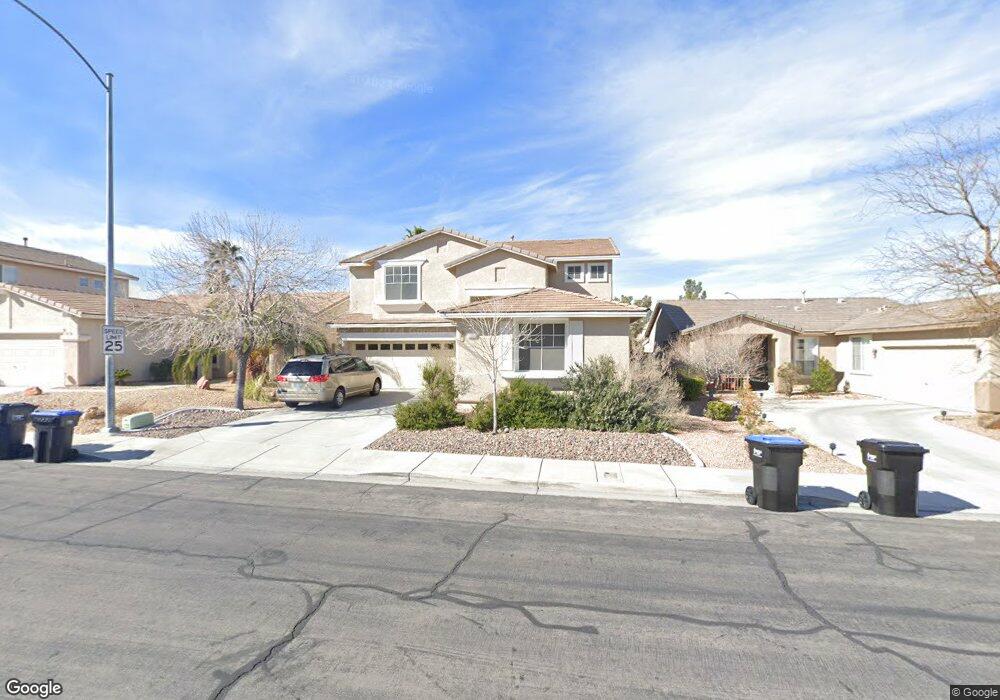
1305 Cadence St Henderson, NV 89052
Anthem Country Club NeighborhoodEstimated Value: $631,329 - $714,000
4
Beds
3
Baths
2,543
Sq Ft
$265/Sq Ft
Est. Value
About This Home
This home is located at 1305 Cadence St, Henderson, NV 89052 and is currently estimated at $674,082, approximately $265 per square foot. 1305 Cadence St is a home located in Clark County with nearby schools including Frank S Lamping Elementary School, Del E. Webb Middle School, and Coronado High School.
Ownership History
Date
Name
Owned For
Owner Type
Purchase Details
Closed on
Feb 22, 2005
Sold by
Quigley Kristina M
Bought by
Storrs John H and Storrs Sandra F
Current Estimated Value
Purchase Details
Closed on
Aug 24, 2004
Sold by
Tupper Jeffrey G and Tupper Hiroko K
Bought by
Quigley Dale E and Quigley Kristina M
Home Financials for this Owner
Home Financials are based on the most recent Mortgage that was taken out on this home.
Original Mortgage
$333,700
Interest Rate
5.95%
Mortgage Type
Unknown
Purchase Details
Closed on
Oct 7, 1999
Sold by
Del Webbs Coventry Homes Of Nevada Inc
Bought by
Tupper Jeffrey G and Tupper Hiroko K
Home Financials for this Owner
Home Financials are based on the most recent Mortgage that was taken out on this home.
Original Mortgage
$203,000
Interest Rate
7.82%
Mortgage Type
VA
Create a Home Valuation Report for This Property
The Home Valuation Report is an in-depth analysis detailing your home's value as well as a comparison with similar homes in the area
Home Values in the Area
Average Home Value in this Area
Purchase History
| Date | Buyer | Sale Price | Title Company |
|---|---|---|---|
| Storrs John H | -- | Nevada Title Company | |
| Quigley Kristina M | -- | Nevada Title Company | |
| Quigley Dale E | $450,000 | Nevada Title Company | |
| Tupper Jeffrey G | $201,000 | Del Webb Title Company |
Source: Public Records
Mortgage History
| Date | Status | Borrower | Loan Amount |
|---|---|---|---|
| Previous Owner | Quigley Dale E | $333,700 | |
| Previous Owner | Tupper Jeffrey G | $203,000 |
Source: Public Records
Tax History Compared to Growth
Tax History
| Year | Tax Paid | Tax Assessment Tax Assessment Total Assessment is a certain percentage of the fair market value that is determined by local assessors to be the total taxable value of land and additions on the property. | Land | Improvement |
|---|---|---|---|---|
| 2025 | $2,840 | $145,176 | $51,800 | $93,376 |
| 2024 | $2,758 | $145,176 | $51,800 | $93,376 |
| 2023 | $2,758 | $143,831 | $55,300 | $88,531 |
| 2022 | $2,251 | $123,583 | $42,700 | $80,883 |
| 2021 | $2,600 | $112,393 | $35,350 | $77,043 |
| 2020 | $2,521 | $109,490 | $33,250 | $76,240 |
| 2019 | $2,448 | $104,463 | $29,400 | $75,063 |
| 2018 | $2,377 | $98,686 | $26,600 | $72,086 |
| 2017 | $2,882 | $99,418 | $26,250 | $73,168 |
| 2016 | $2,251 | $87,174 | $14,000 | $73,174 |
| 2015 | $2,246 | $86,156 | $14,000 | $72,156 |
| 2014 | $2,180 | $73,029 | $10,500 | $62,529 |
Source: Public Records
Map
Nearby Homes
- 2378 Falsetto Ave
- 2285 Moresca Ave
- 2420 Taragato Ave
- 2288 Tedesca Dr Unit 4
- 2383 Rainswept Ave
- 2309 Cut Bank Trail
- 2333 Silver Crew Pass
- 1376 Forlana Dr
- 2504 Libretto Ave
- 2310 Cut Bank Trail
- 2200 Tedesca Dr
- 2280 Bull Lake Dr
- 1426 Fieldbrook St
- 2251 Tedesca Dr
- 3 Isleworth Dr
- 71 Fountainhead Cir
- 2539 Evansville Ave
- 2535 Leighton Ave
- 2548 Leighton Ave
- 77 Fountainhead Cir
- 1307 Cadence St
- 1303 Cadence St
- 1309 Cadence St
- 1306 Tempo St
- 1308 Tempo St
- 1311 Cadence St
- 1310 Tempo St
- 2354 Spirito Ave
- 2356 Spirito Ave
- 1313 Cadence St
- 2352 Spirito Ave
- 1312 Tempo St
- 2358 Spirito Ave Unit 2
- 2350 Spirito Ave
- 2350 Spirito Ave Unit n/a
- 2360 Spirito Ave
- 1315 Cadence St
- 1314 Tempo St
- 2362 Spirito Ave
- 1309 Tempo St