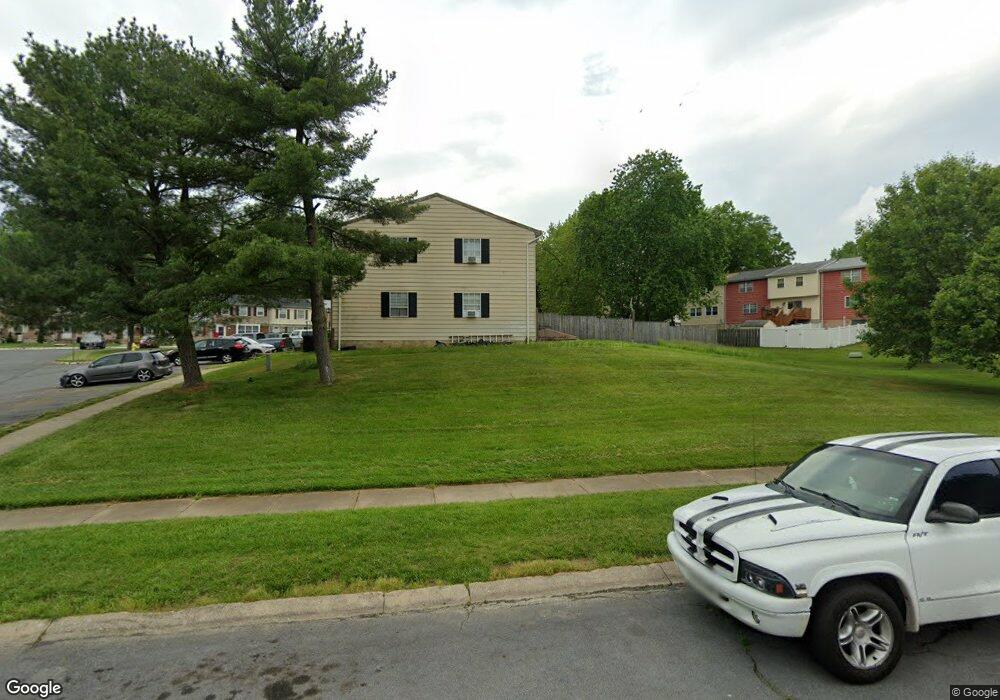
1305 Charlestown Dr Edgewood, MD 21040
Estimated Value: $184,186 - $211,000
3
Beds
3
Baths
1,240
Sq Ft
$161/Sq Ft
Est. Value
About This Home
This home is located at 1305 Charlestown Dr, Edgewood, MD 21040 and is currently estimated at $199,797, approximately $161 per square foot. 1305 Charlestown Dr is a home located in Harford County with nearby schools including Magnolia Elementary School, Magnolia Middle School, and Joppatowne High School.
Ownership History
Date
Name
Owned For
Owner Type
Purchase Details
Closed on
Jun 12, 2020
Sold by
Pullin Eddie
Bought by
Aravindan Nandini and Aravindan Padamaja
Current Estimated Value
Home Financials for this Owner
Home Financials are based on the most recent Mortgage that was taken out on this home.
Original Mortgage
$74,500
Interest Rate
3.1%
Mortgage Type
Unknown
Purchase Details
Closed on
Nov 2, 2009
Sold by
Pullin Eddie L
Bought by
Pullin Eddie L
Purchase Details
Closed on
Aug 5, 1997
Sold by
Schultz Stephen J
Bought by
Pullin Eddie L and Pullin Virginia M
Purchase Details
Closed on
Jul 15, 1985
Sold by
Sampson David C
Bought by
Schultz Stephen J
Home Financials for this Owner
Home Financials are based on the most recent Mortgage that was taken out on this home.
Original Mortgage
$52,010
Interest Rate
12.03%
Create a Home Valuation Report for This Property
The Home Valuation Report is an in-depth analysis detailing your home's value as well as a comparison with similar homes in the area
Home Values in the Area
Average Home Value in this Area
Purchase History
| Date | Buyer | Sale Price | Title Company |
|---|---|---|---|
| Aravindan Nandini | $74,500 | Clearview Settlement Sln Llc | |
| Pullin Eddie L | -- | -- | |
| Pullin Eddie L | $74,000 | -- | |
| Schultz Stephen J | $51,000 | -- |
Source: Public Records
Mortgage History
| Date | Status | Borrower | Loan Amount |
|---|---|---|---|
| Closed | Aravindan Nandini | $74,500 | |
| Previous Owner | Schultz Stephen J | $52,010 | |
| Closed | Pullin Eddie L | -- |
Source: Public Records
Tax History Compared to Growth
Tax History
| Year | Tax Paid | Tax Assessment Tax Assessment Total Assessment is a certain percentage of the fair market value that is determined by local assessors to be the total taxable value of land and additions on the property. | Land | Improvement |
|---|---|---|---|---|
| 2025 | $1,486 | $145,733 | $0 | $0 |
| 2024 | $1,486 | $136,367 | $0 | $0 |
| 2023 | $1,330 | $127,000 | $40,000 | $87,000 |
| 2022 | $1,330 | $122,067 | $0 | $0 |
| 2021 | $0 | $117,133 | $0 | $0 |
| 2020 | $1,295 | $112,200 | $40,000 | $72,200 |
| 2019 | $1,269 | $110,000 | $0 | $0 |
| 2018 | $1,244 | $107,800 | $0 | $0 |
| 2017 | $1,208 | $105,600 | $0 | $0 |
| 2016 | -- | $105,600 | $0 | $0 |
| 2015 | $1,387 | $105,600 | $0 | $0 |
| 2014 | $1,387 | $117,400 | $0 | $0 |
Source: Public Records
Map
Nearby Homes
- 1443 Charlestown Dr
- 1407 Harford Square Dr
- 404 Liberty Ct
- 1454 Harford Square Dr
- 575 Jamestown Ct
- 510 Magnolia Rd
- 814 Windstream Way Unit A
- 713 Cedar Crest Ct
- 828 Windstream Way Unit C
- 1301 Clover Valley Way Unit M
- 1719 B Fountain Rock Way Unit 1719-B
- 1730 Fountain Rock Way Unit C
- 909 Olive Branch Ct
- 1302 Clover Valley Way Unit C
- 1301 Cedar Crest Ct Unit 1301-L
- 1304 Clover Valley Way
- 1701 Fountain Rock Way Unit C
- 725 Managrass Dr
- 733 Managrass Dr
- 413 Rogers Ford Ln
- 1307 Charlestown Dr
- 1303 Charlestown Dr
- 1309 Charlestown Dr
- 1301 Charlestown Dr
- 1311 Charlestown Dr
- 1313 Charlestown Dr
- 1315 Charlestown Dr
- 1481 Harford Square Dr
- 1479 Harford Square Dr
- 1483 Harford Square Dr
- 1477 Harford Square Dr
- 1485 Harford Square Dr
- 1487 Harford Square Dr
- 1491 Harford Square Dr
- 1463 Harford Square Dr
- 1317 Charlestown Dr
- 1319 Charlestown Dr
- 1321 Charlestown Dr
- 1343 Charlestown Dr
- 1341 Charlestown Dr