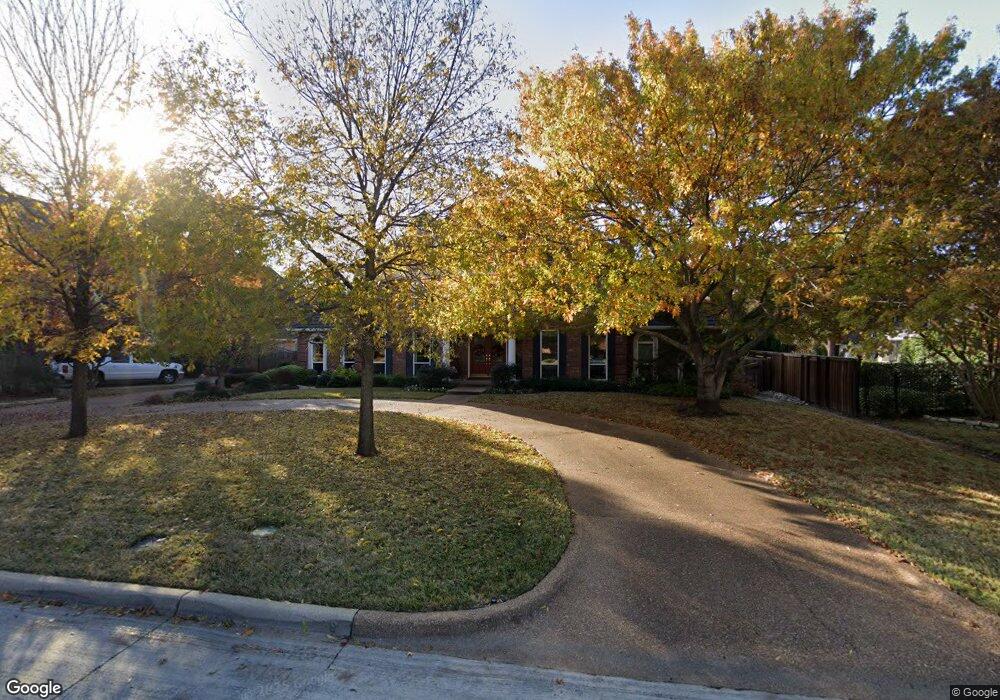
1305 Chatsworth Ct E Colleyville, TX 76034
Estimated Value: $1,194,000 - $1,306,000
4
Beds
4
Baths
4,585
Sq Ft
$270/Sq Ft
Est. Value
About This Home
This home is located at 1305 Chatsworth Ct E, Colleyville, TX 76034 and is currently estimated at $1,240,193, approximately $270 per square foot. 1305 Chatsworth Ct E is a home located in Tarrant County with nearby schools including Bransford Elementary School, Colleyville Middle School, and Covenant Christian Academy.
Ownership History
Date
Name
Owned For
Owner Type
Purchase Details
Closed on
Oct 24, 2003
Sold by
Bearden Mark B and Bearden Paula P
Bought by
Cooley James W and Cooley Caroline A
Current Estimated Value
Home Financials for this Owner
Home Financials are based on the most recent Mortgage that was taken out on this home.
Original Mortgage
$462,000
Outstanding Balance
$211,892
Interest Rate
5.96%
Mortgage Type
Purchase Money Mortgage
Estimated Equity
$1,028,301
Purchase Details
Closed on
Aug 3, 1998
Sold by
Martin Richard Branton and Martin Aurora Dozier
Bought by
Bearden Mark B and Bearden Paula P
Home Financials for this Owner
Home Financials are based on the most recent Mortgage that was taken out on this home.
Original Mortgage
$318,100
Interest Rate
6.94%
Create a Home Valuation Report for This Property
The Home Valuation Report is an in-depth analysis detailing your home's value as well as a comparison with similar homes in the area
Home Values in the Area
Average Home Value in this Area
Purchase History
| Date | Buyer | Sale Price | Title Company |
|---|---|---|---|
| Cooley James W | -- | American Title Co | |
| Bearden Mark B | -- | Ticor Land Title Co |
Source: Public Records
Mortgage History
| Date | Status | Borrower | Loan Amount |
|---|---|---|---|
| Open | Cooley James W | $462,000 | |
| Previous Owner | Bearden Mark B | $318,100 |
Source: Public Records
Tax History Compared to Growth
Tax History
| Year | Tax Paid | Tax Assessment Tax Assessment Total Assessment is a certain percentage of the fair market value that is determined by local assessors to be the total taxable value of land and additions on the property. | Land | Improvement |
|---|---|---|---|---|
| 2025 | $3,047 | $1,129,527 | $249,650 | $879,877 |
| 2024 | $3,047 | $1,129,527 | $249,650 | $879,877 |
| 2023 | $12,600 | $1,136,141 | $249,650 | $886,491 |
| 2022 | $13,411 | $895,901 | $249,650 | $646,251 |
| 2021 | $13,556 | $617,293 | $149,790 | $467,503 |
| 2020 | $13,717 | $617,293 | $149,790 | $467,503 |
| 2019 | $14,629 | $632,730 | $165,000 | $467,730 |
| 2018 | $3,591 | $604,054 | $165,000 | $439,054 |
| 2017 | $13,984 | $591,907 | $165,000 | $426,907 |
| 2016 | $13,667 | $578,505 | $165,000 | $413,505 |
| 2015 | $12,712 | $557,100 | $85,000 | $472,100 |
| 2014 | $12,712 | $557,100 | $85,000 | $472,100 |
Source: Public Records
Map
Nearby Homes
- 4812 Carmel Place
- 4516 Dartmoore Ln
- 4600 Westbury Dr
- 4600 Stafford Dr
- 1104 Garry Lynne Dr
- 5104 Preservation Ave
- 4105 Inwood Ln
- 5200 Preservation Ave
- 37 Piazza Ln
- 1521 Four Seasons Dr
- 1505 Four Seasons Dr
- 1504 Four Seasons Dr
- 1533 Four Seasons Dr
- 1536 Four Seasons Dr
- 1513 Four Seasons Dr
- Lot 3 Amelia Ct
- 1517 Four Seasons Dr
- 1525 Four Seasons Dr
- 1532 Four Seasons Dr
- 1303 Crest Dr
- 1309 Chatsworth Ct E
- 1301 Chatsworth Ct E
- 1313 Chatsworth Ct E
- 1304 Ashford Ct
- 1308 Ashford Ct
- 1300 Ashford Ct
- 1304 Chatsworth Ct E
- 1300 Chatsworth Ct E
- 4612 Alexandra Dr
- 1308 Chatsworth Ct E
- 1312 Ashford Ct
- 1312 Chatsworth Ct E
- 4608 Alexandra Dr
- 1216 Chatsworth Dr
- 1213 Chatsworth Dr
- 4604 Alexandra Dr
- 4808 Carmel Place
- 4700 Stafford Dr
- 4600 Alexandra Dr
- 1212 Chatsworth Dr