Estimated Value: $523,000 - $561,000
4
Beds
3
Baths
1,976
Sq Ft
$274/Sq Ft
Est. Value
About This Home
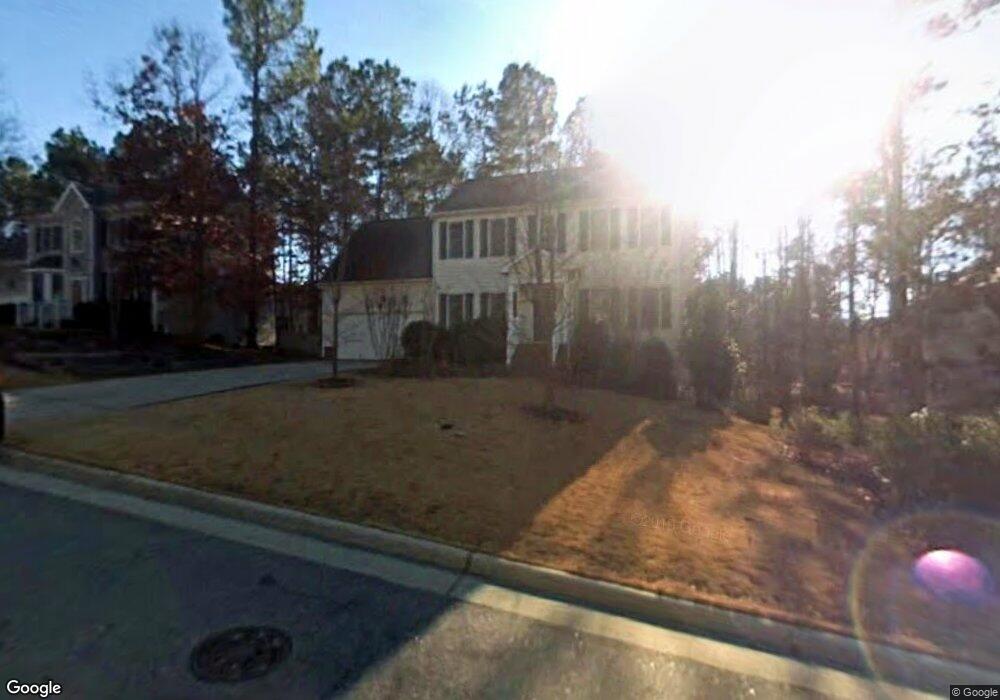
This home is located at 1305 Chenworth Dr, Apex, NC 27502 and is currently estimated at $540,447, approximately $273 per square foot. 1305 Chenworth Dr is a home located in Wake County with nearby schools including Olive Chapel Elementary School, Lufkin Road Middle School, and Apex Friendship High School.
Ownership History
Date
Name
Owned For
Owner Type
Purchase Details
Closed on
Aug 28, 2015
Sold by
Weisenreder Matthew and Weisenreder Heather
Bought by
Holland Justin Tracy and Holland Christal Edwards
Current Estimated Value
Home Financials for this Owner
Home Financials are based on the most recent Mortgage that was taken out on this home.
Original Mortgage
$280,912
Outstanding Balance
$221,985
Interest Rate
4.09%
Mortgage Type
VA
Estimated Equity
$318,462
Purchase Details
Closed on
Dec 1, 2011
Sold by
Griswold Douglas E and Griswold Heather B
Bought by
Weisenreder Matthew and Weisenreder Heather
Home Financials for this Owner
Home Financials are based on the most recent Mortgage that was taken out on this home.
Original Mortgage
$209,000
Interest Rate
4.15%
Mortgage Type
New Conventional
Create a Home Valuation Report for This Property
The Home Valuation Report is an in-depth analysis detailing your home's value as well as a comparison with similar homes in the area
Purchase History
We collect this data history from publicly available records. To have your information removed, we recommend requesting removal directly through your county’s website.
| Date | Buyer | Sale Price | Title Company |
|---|---|---|---|
| Holland Justin Tracy | $275,000 | Attorney | |
| Weisenreder Matthew | $220,000 | Morehead Title Company |
Source: Public Records
Mortgage History
We collect this data history from publicly available records. To have your information removed, we recommend requesting removal directly through your county’s website.
| Date | Status | Borrower | Loan Amount |
|---|---|---|---|
| Open | Holland Justin Tracy | $280,912 | |
| Previous Owner | Weisenreder Matthew | $209,000 |
Source: Public Records
Tax History
| Year | Tax Paid | Tax Assessment Tax Assessment Total Assessment is a certain percentage of the fair market value that is determined by local assessors to be the total taxable value of land and additions on the property. | Land | Improvement |
|---|---|---|---|---|
| 2025 | $4,384 | $499,840 | $180,000 | $319,840 |
| 2024 | $4,286 | $499,840 | $180,000 | $319,840 |
| 2023 | $3,488 | $316,171 | $88,000 | $228,171 |
| 2022 | $3,275 | $316,171 | $88,000 | $228,171 |
| 2021 | $3,150 | $316,171 | $88,000 | $228,171 |
| 2020 | $3,118 | $316,171 | $88,000 | $228,171 |
| 2019 | $3,026 | $264,690 | $88,000 | $176,690 |
| 2018 | $2,851 | $264,690 | $88,000 | $176,690 |
| 2017 | $2,654 | $264,690 | $88,000 | $176,690 |
| 2016 | $2,615 | $264,690 | $88,000 | $176,690 |
| 2015 | -- | $250,612 | $72,000 | $178,612 |
| 2014 | $2,446 | $250,612 | $72,000 | $178,612 |
Source: Public Records
Map
Nearby Homes
- 1305 Olde Walker Mill Rd
- 3021 White Cloud Cir
- 1224 Tartarian Trail
- 2113 Barrier Ridge Way
- 2117 Barrier Ridge Way
- 2115 Barrier Ridge Way
- 1002 Chickering Ct
- 2119 Barrier Ridge Way
- 113 Curley Maple Ct
- 1200 Alderwood Ct
- 2112 Barrier Ridge Way
- 2118 Barrier Ridge Way
- 2122 Barrier Ridge Way
- 1110 Palisade Bluff Ln
- 1127 Palisade Bluff Ln
- 1464 Big Leaf Loop
- 1103 Palisade Bluff Ln
- 1126 Palisade Bluff Ln
- 1122 Palisade Bluff Ln
- 1107 Palisade Bluff Ln
- 1303 Chenworth Dr
- 1306 Patterson Grove Rd
- 1304 Patterson Grove Rd
- 1309 Chenworth Dr
- 1301 Brycker Ct
- 1301 Chenworth Dr
- 1207 Pearson Farms Rd
- 1304 Chenworth Dr
- 1308 Chenworth Dr
- 1302 Patterson Grove Rd
- 1113 Pearson Farms Rd
- 1303 Brycker Ct
- 1308 Patterson Grove Rd
- 1310 Chenworth Dr
- 1111 Pearson Farms Rd
- 1300 Patterson Grove Rd
- 1303 Albertson Place
- 1204 Pearson Farms Rd
- 1304 Brycker Ct
- 1202 Pearson Farms Rd
Your Personal Tour Guide
Ask me questions while you tour the home.