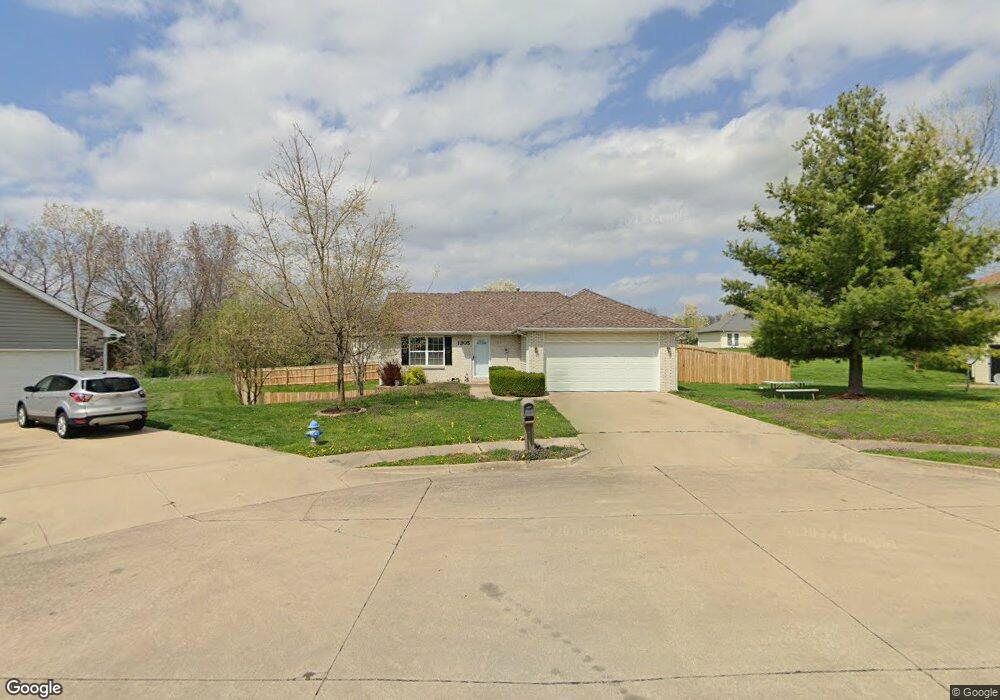
1305 Count Fleet Ct Columbia, MO 65202
Estimated Value: $204,000 - $276,000
3
Beds
2
Baths
1,184
Sq Ft
$208/Sq Ft
Est. Value
About This Home
This home is located at 1305 Count Fleet Ct, Columbia, MO 65202 and is currently estimated at $246,525, approximately $208 per square foot. 1305 Count Fleet Ct is a home located in Boone County with nearby schools including Derby Ridge Elementary School, John B. Lange Middle School, and Muriel W. Battle High School.
Ownership History
Date
Name
Owned For
Owner Type
Purchase Details
Closed on
Apr 26, 2021
Sold by
Johnson Shelia and Stapleton Earl E
Bought by
Johnson Shelia
Current Estimated Value
Home Financials for this Owner
Home Financials are based on the most recent Mortgage that was taken out on this home.
Original Mortgage
$142,500
Outstanding Balance
$128,939
Interest Rate
3%
Mortgage Type
New Conventional
Estimated Equity
$117,586
Purchase Details
Closed on
Apr 23, 2015
Sold by
Johnson Shelia and Stapleton Earl E
Bought by
Johnson Shelia and Stapleton Earl E
Home Financials for this Owner
Home Financials are based on the most recent Mortgage that was taken out on this home.
Original Mortgage
$115,070
Interest Rate
3.87%
Mortgage Type
FHA
Purchase Details
Closed on
Apr 13, 2012
Sold by
Aon Llc
Bought by
Johnson Shelia and Johnson Allean
Home Financials for this Owner
Home Financials are based on the most recent Mortgage that was taken out on this home.
Original Mortgage
$118,907
Interest Rate
4.4%
Mortgage Type
FHA
Create a Home Valuation Report for This Property
The Home Valuation Report is an in-depth analysis detailing your home's value as well as a comparison with similar homes in the area
Home Values in the Area
Average Home Value in this Area
Purchase History
| Date | Buyer | Sale Price | Title Company |
|---|---|---|---|
| Johnson Shelia | -- | None Available | |
| Johnson Shelia | -- | Town And Country Title | |
| Johnson Shelia | -- | None Available |
Source: Public Records
Mortgage History
| Date | Status | Borrower | Loan Amount |
|---|---|---|---|
| Open | Johnson Shelia | $142,500 | |
| Closed | Johnson Shelia | $115,070 | |
| Closed | Johnson Shelia | $118,907 |
Source: Public Records
Tax History Compared to Growth
Tax History
| Year | Tax Paid | Tax Assessment Tax Assessment Total Assessment is a certain percentage of the fair market value that is determined by local assessors to be the total taxable value of land and additions on the property. | Land | Improvement |
|---|---|---|---|---|
| 2025 | $1,801 | $30,571 | $3,990 | $26,581 |
| 2024 | $1,801 | $26,695 | $3,990 | $22,705 |
| 2023 | $1,786 | $26,695 | $3,990 | $22,705 |
| 2022 | $1,716 | $25,669 | $3,990 | $21,679 |
| 2021 | $1,719 | $25,669 | $3,990 | $21,679 |
| 2020 | $1,693 | $23,761 | $3,990 | $19,771 |
| 2019 | $1,693 | $23,761 | $3,990 | $19,771 |
| 2018 | $1,579 | $0 | $0 | $0 |
| 2017 | $1,560 | $22,002 | $3,990 | $18,012 |
| 2016 | $1,557 | $22,002 | $3,990 | $18,012 |
| 2015 | $1,430 | $22,002 | $3,990 | $18,012 |
| 2014 | $1,435 | $22,002 | $3,990 | $18,012 |
Source: Public Records
Map
Nearby Homes
- 3800 Saddlebrook Place Unit 408
- 3800 Saddlebrook Place Unit 503
- 3903 Triple Crown Dr
- 3803 Triple Crown Dr
- 1302 Look Out Ct
- 3417 Derby Ridge Dr
- 3810 Crocodile Dr
- 0 Rangeline St
- 4116 N Citation Dr
- 4304-4306 Derby Ridge Dr
- 3205 Sagegrass Ct
- 1760 E Eldorado Dr
- 1709 Blue Ridge Rd
- 1809 Blue Ridge Rd
- 1100 Kennesaw Unit 102
- 1100 Kennesaw Unit 301
- 1100 Kennesaw Unit 104
- 1912 Lovejoy Ln
- 5556 Sweetgum Cir
- 3308 Ravello Dr
- 1309 Count Fleet Ct
- 1302 Whirlaway Ct
- 1301 Count Fleet Ct
- 1304 Whirlaway Ct
- 1300 Whirlaway Ct
- 1313 Count Fleet Ct
- 1304 Count Fleet Ct
- 1300 Count Fleet Ct
- 1308 Count Fleet Ct
- 1306 Whirlaway Ct
- 1312 Count Fleet Ct
- 1301 Whirlaway Ct
- 1303 Seattle Slew Dr
- 1303 Whirlaway Ct
- 1305 Whirlaway Ct
- 1305 Seattle Slew Dr
- 1301 Seattle Slew Dr
- 1307 Whirlaway Ct
- 1307 Seattle Slew Dr
- 3812 Derby Ridge Dr