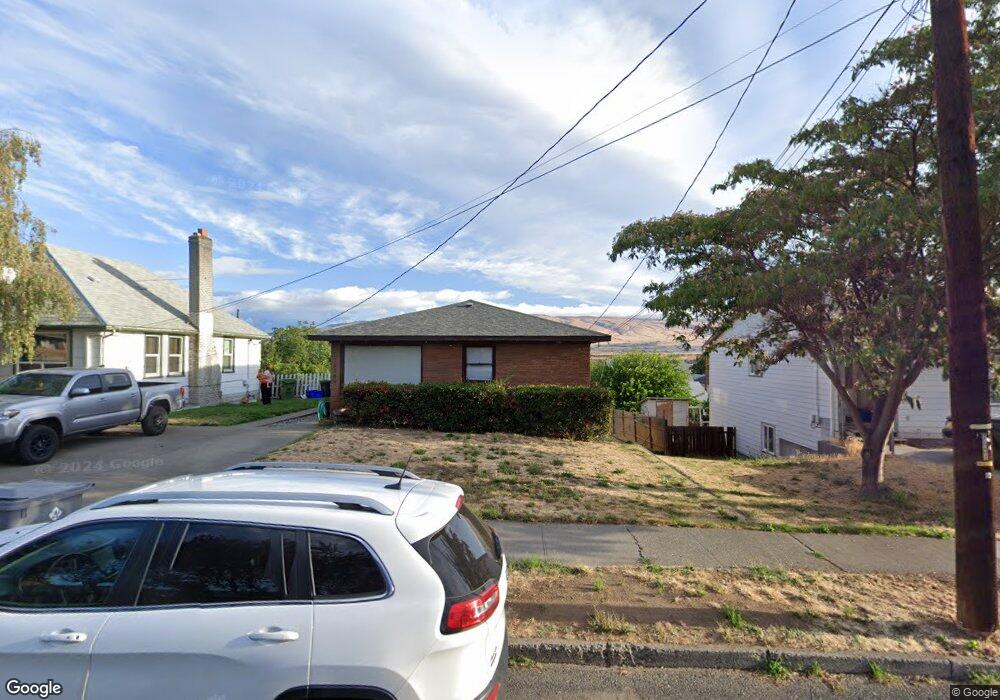
1305 E 11th St the Dalles, OR 97058
Estimated Value: $351,000 - $386,649
4
Beds
2
Baths
1,820
Sq Ft
$203/Sq Ft
Est. Value
About This Home
This home is located at 1305 E 11th St, the Dalles, OR 97058 and is currently estimated at $368,825, approximately $202 per square foot. 1305 E 11th St is a home located in Wasco County with nearby schools including Dry Hollow Elementary School, The Dalles Middle School, and The Dalles High School.
Ownership History
Date
Name
Owned For
Owner Type
Purchase Details
Closed on
Dec 3, 2020
Sold by
Peterson Garry W and Peterson Margaret G
Bought by
Trujillo Angel and Trujillo Payton
Current Estimated Value
Home Financials for this Owner
Home Financials are based on the most recent Mortgage that was taken out on this home.
Original Mortgage
$270,019
Outstanding Balance
$240,826
Interest Rate
2.8%
Mortgage Type
FHA
Estimated Equity
$127,999
Purchase Details
Closed on
Jul 21, 2016
Sold by
Peterson Garry W
Bought by
Peterson Garry W and Peterson Margaret G
Create a Home Valuation Report for This Property
The Home Valuation Report is an in-depth analysis detailing your home's value as well as a comparison with similar homes in the area
Home Values in the Area
Average Home Value in this Area
Purchase History
| Date | Buyer | Sale Price | Title Company |
|---|---|---|---|
| Trujillo Angel | $275,000 | Amerititle | |
| Peterson Garry W | -- | None Available |
Source: Public Records
Mortgage History
| Date | Status | Borrower | Loan Amount |
|---|---|---|---|
| Open | Trujillo Angel | $270,019 |
Source: Public Records
Tax History Compared to Growth
Tax History
| Year | Tax Paid | Tax Assessment Tax Assessment Total Assessment is a certain percentage of the fair market value that is determined by local assessors to be the total taxable value of land and additions on the property. | Land | Improvement |
|---|---|---|---|---|
| 2024 | $3,467 | $192,614 | -- | -- |
| 2023 | $3,366 | $187,004 | $0 | $0 |
| 2022 | $3,291 | $65,485 | $0 | $0 |
| 2021 | $3,190 | $63,578 | $0 | $0 |
| 2020 | $3,111 | $61,726 | $0 | $0 |
| 2019 | $3,286 | $59,928 | $0 | $0 |
| 2018 | $3,173 | $161,311 | $0 | $0 |
| 2017 | $3,035 | $156,613 | $0 | $0 |
| 2016 | $3,026 | $152,051 | $0 | $0 |
| 2015 | $2,975 | $147,622 | $0 | $0 |
| 2014 | $2,892 | $143,322 | $0 | $0 |
Source: Public Records
Map
Nearby Homes
- 1016 Clark St
- 1022 E 10th St
- 1221 Lewis St
- 1014 E 7th St
- 1520 E 9th St
- 1416 E 14th St
- 1300 View Ct
- 700 E 2nd St
- 809 E 7th St
- 531 E 8th St
- 804 E 13th St
- 0 E 12th St Unit 346314188
- 722 E 14th St
- 1014 Laughlin St
- 1825 Minnesota St
- 101 N Boat Basin Rd Unit A-09
- 319 E 7th St
- 1705 Nevada St
- 1613 Oregon St
- 1831 E 14th St
- 1311 E 11th St
- 1301 E 11th St
- 1313 E 11th St
- 1221 E 11th St
- 1320 E 11th
- 1317 E 11th St
- 1224 E 10th St
- 1222 E 10th St
- 1300 E 10th St
- 1219 E 11th St
- 1300 E 11th St
- 1220 E 10th St
- 1319 E 11th St
- 1302 E 10th St
- 1312 E 11th St
- 1216 E 10th St
- 1304 E 10th St
- 1316 E 11th St
- 1316 E 11th St Unit 22
- 1211 E 11th St