1305 E 19th Ave Unit 307 Columbus, OH 43211
South Linden NeighborhoodEstimated Value: $141,000 - $227,000
6
Beds
2
Baths
2,352
Sq Ft
$76/Sq Ft
Est. Value
About This Home
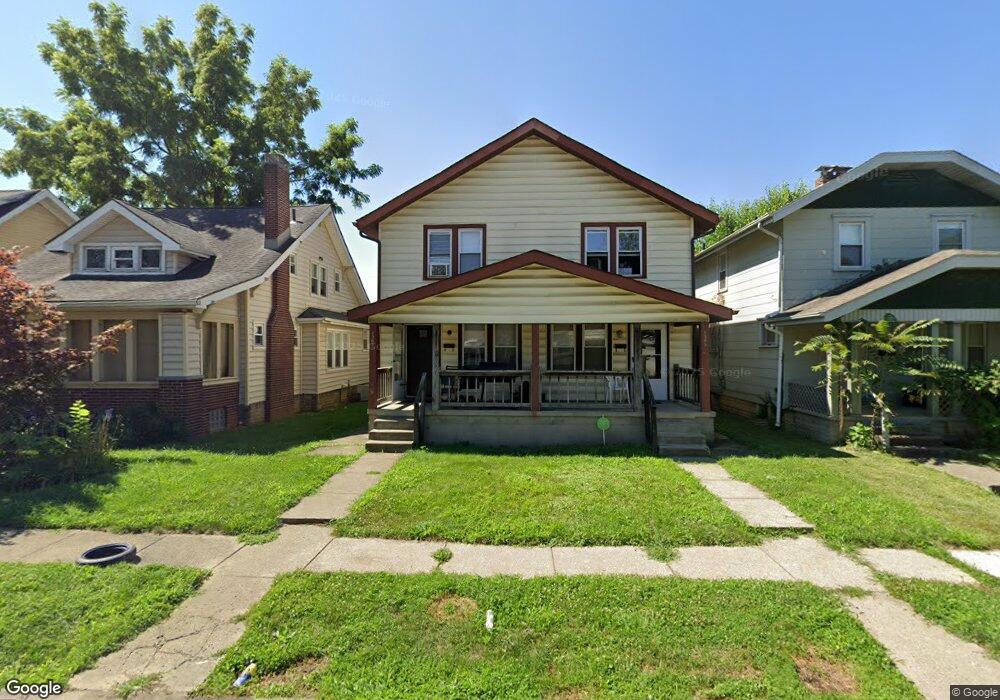
This home is located at 1305 E 19th Ave Unit 307, Columbus, OH 43211 and is currently estimated at $179,510, approximately $76 per square foot. 1305 E 19th Ave Unit 307 is a home located in Franklin County with nearby schools including Windsor Stem Acadmey, Linden-Mckinley Stem School On Arcadia, and North Columbus Preparatory Academy.
Ownership History
Date
Name
Owned For
Owner Type
Purchase Details
Closed on
Dec 2, 2020
Sold by
Hannah Douglas
Bought by
Hannah Leslie J and 1305 Trust
Current Estimated Value
Purchase Details
Closed on
Jul 17, 2019
Sold by
The Bank Of New York Mellon
Bought by
Hannah Douglas
Purchase Details
Closed on
Sep 2, 1997
Sold by
Baird Steve M
Bought by
Simms Investments Company
Home Financials for this Owner
Home Financials are based on the most recent Mortgage that was taken out on this home.
Original Mortgage
$53,993
Interest Rate
7.54%
Purchase Details
Closed on
Jul 14, 1997
Sold by
Simms Investment Company
Bought by
Lewis Eugene C
Home Financials for this Owner
Home Financials are based on the most recent Mortgage that was taken out on this home.
Original Mortgage
$53,993
Interest Rate
7.54%
Create a Home Valuation Report for This Property
The Home Valuation Report is an in-depth analysis detailing your home's value as well as a comparison with similar homes in the area
Home Values in the Area
Average Home Value in this Area
Purchase History
| Date | Buyer | Sale Price | Title Company |
|---|---|---|---|
| Hannah Leslie J | -- | None Available | |
| Hannah Douglas | $75,000 | Novare National Setmnt Svc | |
| Simms Investments Company | -- | -- | |
| Lewis Eugene C | $62,000 | -- |
Source: Public Records
Mortgage History
| Date | Status | Borrower | Loan Amount |
|---|---|---|---|
| Previous Owner | Lewis Eugene C | $53,993 |
Source: Public Records
Tax History Compared to Growth
Tax History
| Year | Tax Paid | Tax Assessment Tax Assessment Total Assessment is a certain percentage of the fair market value that is determined by local assessors to be the total taxable value of land and additions on the property. | Land | Improvement |
|---|---|---|---|---|
| 2024 | $2,121 | $46,280 | $5,430 | $40,850 |
| 2023 | $2,094 | $46,280 | $5,430 | $40,850 |
| 2022 | $1,122 | $21,110 | $2,280 | $18,830 |
| 2021 | $1,124 | $21,110 | $2,280 | $18,830 |
| 2020 | $1,126 | $21,110 | $2,280 | $18,830 |
| 2019 | $1,095 | $17,610 | $1,930 | $15,680 |
| 2018 | $1,190 | $17,610 | $1,930 | $15,680 |
| 2017 | $1,095 | $17,610 | $1,930 | $15,680 |
| 2016 | $618 | $9,100 | $2,450 | $6,650 |
| 2015 | $1,113 | $17,990 | $2,450 | $15,540 |
| 2014 | $1,115 | $17,990 | $2,450 | $15,540 |
| 2013 | $611 | $19,985 | $2,730 | $17,255 |
Source: Public Records
Map
Nearby Homes
- 1288-1292 E 19th Ave
- 1287 E 19th Ave
- 1273-1275 E 18th Ave
- 1292 E 17th Ave
- 1369-1371 E 18th Ave
- 1386 E 22nd Ave
- 1366 E 17th Ave Unit 368
- 1371 E 23rd Ave
- 1316 E 16th Ave
- 1411 E 18th Ave
- 1326 E 23rd Ave
- 1384 E 23rd Ave
- 1661 Cleveland Ave Unit 1659
- 1231 E 23rd Ave
- 1161 E 22nd Ave Unit 1159
- 1249-1251 E 15th Ave
- 1082-1084 E 17th Ave
- 1094 E 16th Ave
- 1335 E 25th Ave Unit 337
- 1088 E 21st Ave
- 1305 E 19th Ave Unit 7
- 1311 E 19th Ave
- 1301 E 19th Ave
- 1315 E 19th Ave
- 1295 E 19th Ave
- 1289 E 19th Ave
- 1731 Louis Ave Unit 733
- 1306 E 19th Ave
- 1725 Louis Ave Unit 727
- 1327 E 19th Ave
- 1298 E 18th Ave Unit 300
- 1298-1300 E 18th Ave
- 1292 E 18th Ave Unit 294
- 1290 E 18th Ave
- 1310 E 19th Ave
- 1288 E 18th Ave Unit 290
- 1288 E 18th Ave
- 1300 E 19th Ave
- 1281 E 19th Ave
- 1316 E 19th Ave