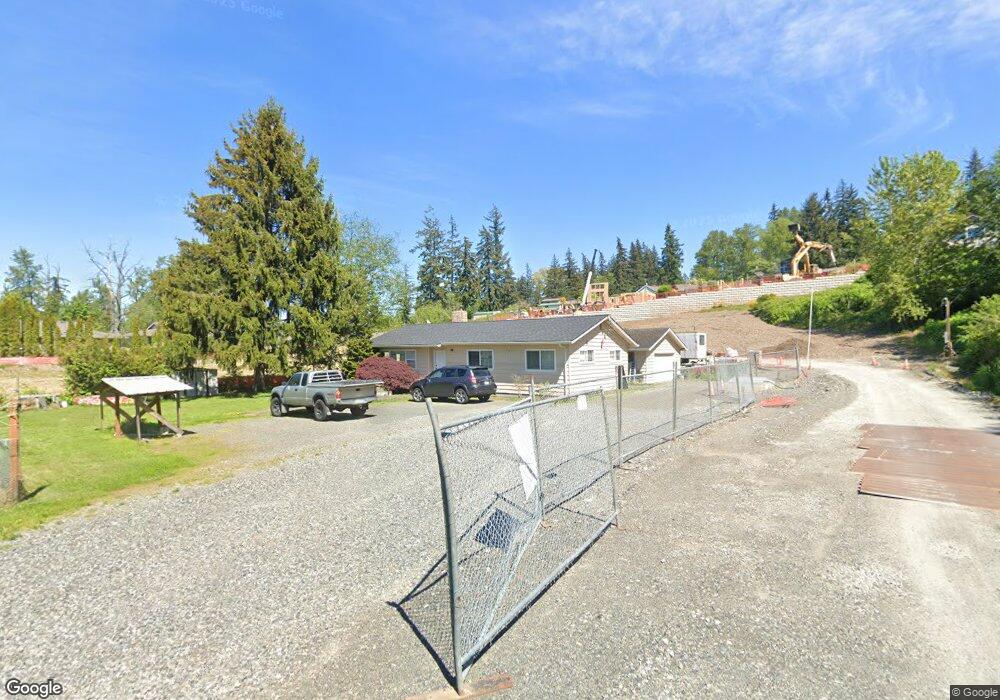
1305 Edwards St Bellingham, WA 98229
Puget NeighborhoodEstimated Value: $546,952 - $635,000
3
Beds
1
Bath
1,292
Sq Ft
$454/Sq Ft
Est. Value
About This Home
This home is located at 1305 Edwards St, Bellingham, WA 98229 and is currently estimated at $586,238, approximately $453 per square foot. 1305 Edwards St is a home located in Whatcom County with nearby schools including Carl Cozier Elementary School, Kulshan Middle School, and Sehome High School.
Ownership History
Date
Name
Owned For
Owner Type
Purchase Details
Closed on
Dec 28, 2012
Sold by
Cribbs Glenn H
Bought by
Cribbs Property Management Llc
Current Estimated Value
Purchase Details
Closed on
Aug 30, 2011
Sold by
Wells Fargo Bank N A
Bought by
Cribbs Glenn H
Purchase Details
Closed on
Apr 22, 2011
Sold by
Mitchell Mark J and Mitchell Ashlie M
Bought by
Wells Fargo Bank N A
Purchase Details
Closed on
Aug 15, 2000
Sold by
Zehe Richard and Zehe Julia
Bought by
Mitchell Mark J and Mitchell Ashlie M
Home Financials for this Owner
Home Financials are based on the most recent Mortgage that was taken out on this home.
Original Mortgage
$111,300
Interest Rate
8.16%
Purchase Details
Closed on
Apr 26, 1999
Sold by
Federal National Mortgage Association
Bought by
Zehe Richard and Zehe Julia
Home Financials for this Owner
Home Financials are based on the most recent Mortgage that was taken out on this home.
Original Mortgage
$99,182
Interest Rate
6.98%
Mortgage Type
FHA
Create a Home Valuation Report for This Property
The Home Valuation Report is an in-depth analysis detailing your home's value as well as a comparison with similar homes in the area
Home Values in the Area
Average Home Value in this Area
Purchase History
| Date | Buyer | Sale Price | Title Company |
|---|---|---|---|
| Cribbs Property Management Llc | -- | None Available | |
| Cribbs Glenn H | $145,280 | First American Title Ins | |
| Wells Fargo Bank N A | $14,425 | None Available | |
| Mitchell Mark J | $123,711 | Chicago Title Insurance | |
| Zehe Richard | -- | Island Title |
Source: Public Records
Mortgage History
| Date | Status | Borrower | Loan Amount |
|---|---|---|---|
| Previous Owner | Mitchell Mark J | $111,300 | |
| Previous Owner | Zehe Richard | $99,182 |
Source: Public Records
Tax History Compared to Growth
Tax History
| Year | Tax Paid | Tax Assessment Tax Assessment Total Assessment is a certain percentage of the fair market value that is determined by local assessors to be the total taxable value of land and additions on the property. | Land | Improvement |
|---|---|---|---|---|
| 2024 | $3,394 | $420,897 | $208,641 | $212,256 |
| 2023 | $3,394 | $435,945 | $216,100 | $219,845 |
| 2022 | $2,779 | $371,019 | $183,916 | $187,103 |
| 2021 | $2,583 | $299,218 | $148,324 | $150,894 |
| 2020 | $2,537 | $262,469 | $130,107 | $132,362 |
| 2019 | $2,210 | $249,140 | $123,500 | $125,640 |
| 2018 | $2,294 | $217,598 | $93,798 | $123,800 |
| 2017 | $2,021 | $193,149 | $83,258 | $109,891 |
| 2016 | $1,842 | $177,859 | $76,608 | $101,251 |
| 2015 | $1,813 | $168,686 | $72,618 | $96,068 |
| 2014 | -- | $160,649 | $69,160 | $91,489 |
| 2013 | -- | $152,892 | $66,500 | $86,392 |
Source: Public Records
Map
Nearby Homes
- 1401 Edwards St
- 1227 Puget St
- 1200 Lincoln St Unit 196
- 1200 Lincoln St Unit 117
- 1200 Lincoln St Unit 154
- 0 Lopez St
- 905 Queen St
- 1501 Lakeway Dr
- 1356 Orleans St
- 805 Nevada St
- 115 43rd St
- 143 S 44th St
- 1234 Grant St
- 1205 E Maple St
- 910 Gladstone St Unit 205
- 1470 James St
- 1142 Whidbey St
- 1146 Whidbey St
- 1101 Whidbey St
- 4224 Dumas Ave
- 1321 Edwards St
- 1255 Edwards St
- 1255 Edwards St
- 1235 Edwards St
- 1329 Whatcom St Unit 15
- 1327 Whatcom St
- 1327 Whatcom St Unit 14
- 1333 Whatcom St Unit 16
- 1335 Whatcom St
- 1323 Whatcom St Unit 13
- 1321 Whatcom St
- 1339 Whatcom St Unit 18
- 1319 Whatcom St
- 1345 Whatcom St Unit 19
- 1414 Edwards St
- 1315 Whatcom St
- 1102 Nevada St
- 1106 Nevada St
- 1324 Whatcom St Unit 9
- 1320 Whatcom St Unit 8