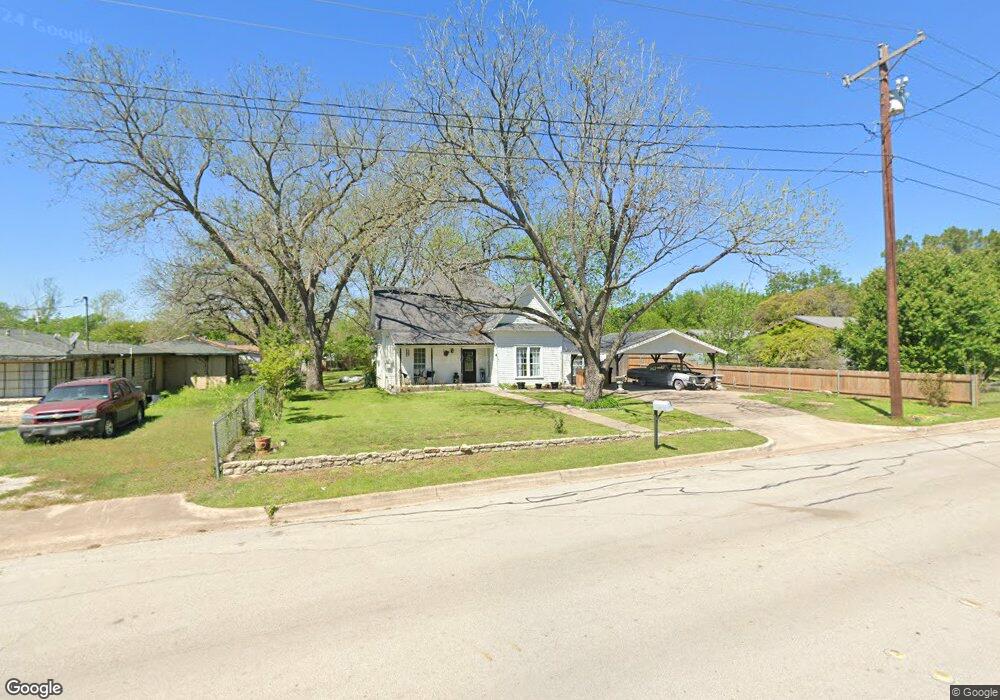
1305 Franklin St Weatherford, TX 76086
Estimated Value: $224,221 - $278,000
--
Bed
--
Bath
1,535
Sq Ft
$167/Sq Ft
Est. Value
About This Home
This home is located at 1305 Franklin St, Weatherford, TX 76086 and is currently estimated at $257,055, approximately $167 per square foot. 1305 Franklin St is a home located in Parker County with nearby schools including Seguin Elementary School, Tison Middle School, and Weatherford High School.
Ownership History
Date
Name
Owned For
Owner Type
Purchase Details
Closed on
Jul 18, 2008
Sold by
Ramirez Isidro and Ramirez Dolores
Bought by
Ramirez Dolores
Current Estimated Value
Home Financials for this Owner
Home Financials are based on the most recent Mortgage that was taken out on this home.
Original Mortgage
$60,900
Outstanding Balance
$39,328
Interest Rate
6.09%
Mortgage Type
Credit Line Revolving
Estimated Equity
$217,727
Purchase Details
Closed on
Dec 23, 1981
Bought by
Ramirez Dolores
Create a Home Valuation Report for This Property
The Home Valuation Report is an in-depth analysis detailing your home's value as well as a comparison with similar homes in the area
Home Values in the Area
Average Home Value in this Area
Purchase History
| Date | Buyer | Sale Price | Title Company |
|---|---|---|---|
| Ramirez Dolores | -- | Stnt | |
| Ramirez Dolores | -- | -- |
Source: Public Records
Mortgage History
| Date | Status | Borrower | Loan Amount |
|---|---|---|---|
| Open | Ramirez Dolores | $60,900 |
Source: Public Records
Tax History Compared to Growth
Tax History
| Year | Tax Paid | Tax Assessment Tax Assessment Total Assessment is a certain percentage of the fair market value that is determined by local assessors to be the total taxable value of land and additions on the property. | Land | Improvement |
|---|---|---|---|---|
| 2025 | $951 | $208,084 | -- | -- |
| 2024 | $951 | $189,167 | -- | -- |
| 2023 | $951 | $171,970 | $0 | $0 |
| 2022 | $3,468 | $156,340 | $15,000 | $141,340 |
| 2021 | $3,476 | $156,340 | $15,000 | $141,340 |
| 2020 | $3,180 | $131,590 | $15,000 | $116,590 |
| 2019 | $3,129 | $131,590 | $15,000 | $116,590 |
| 2018 | $2,857 | $111,380 | $15,000 | $96,380 |
| 2017 | $2,718 | $111,380 | $15,000 | $96,380 |
| 2016 | $2,470 | $93,890 | $15,000 | $78,890 |
| 2015 | $1,708 | $93,890 | $15,000 | $78,890 |
| 2014 | $1,917 | $84,690 | $15,000 | $69,690 |
Source: Public Records
Map
Nearby Homes