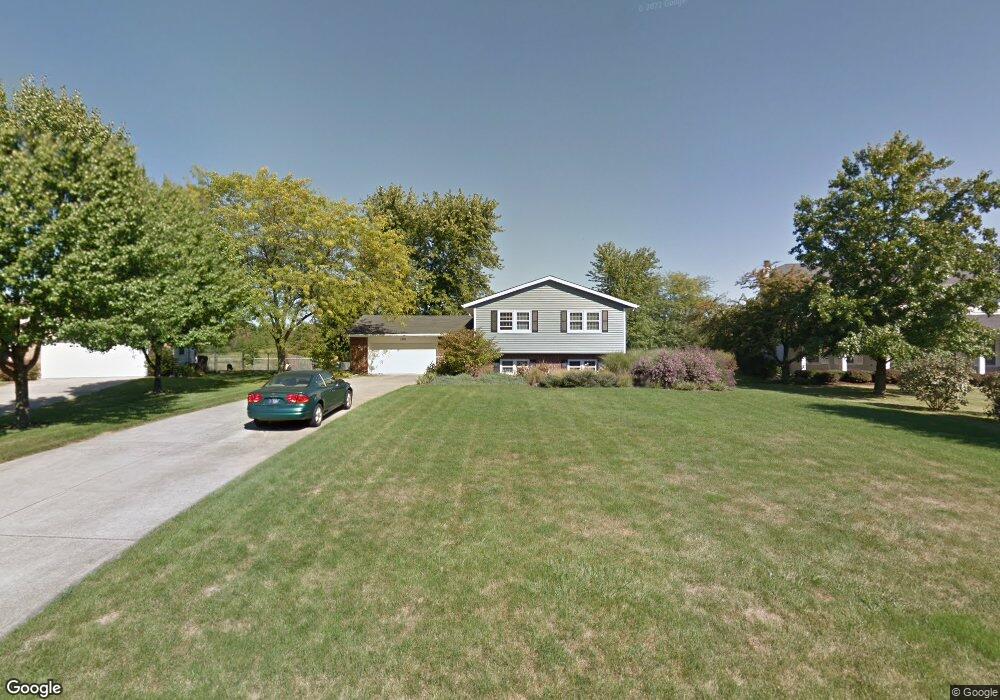
1305 Meadowglen Dr Valparaiso, IN 46383
Estimated Value: $377,000 - $438,000
4
Beds
2
Baths
2,788
Sq Ft
$147/Sq Ft
Est. Value
About This Home
This home is located at 1305 Meadowglen Dr, Valparaiso, IN 46383 and is currently estimated at $408,457, approximately $146 per square foot. 1305 Meadowglen Dr is a home located in Porter County with nearby schools including Parkview Elementary School, Thomas Jefferson Middle School, and Valparaiso High School.
Ownership History
Date
Name
Owned For
Owner Type
Purchase Details
Closed on
Oct 8, 2020
Sold by
Rivera Jose L
Bought by
Shuta Benjamin and Shuta Amber
Current Estimated Value
Home Financials for this Owner
Home Financials are based on the most recent Mortgage that was taken out on this home.
Original Mortgage
$280,330
Outstanding Balance
$249,339
Interest Rate
2.9%
Mortgage Type
New Conventional
Estimated Equity
$159,118
Purchase Details
Closed on
Jul 6, 2017
Sold by
John
Bought by
Jose
Home Financials for this Owner
Home Financials are based on the most recent Mortgage that was taken out on this home.
Original Mortgage
$230,743
Interest Rate
4.4%
Mortgage Type
FHA
Purchase Details
Closed on
Jun 7, 2017
Sold by
Schrader John F and Schrader Patricia A
Bought by
Rivera Jose L
Home Financials for this Owner
Home Financials are based on the most recent Mortgage that was taken out on this home.
Original Mortgage
$230,743
Interest Rate
4.4%
Mortgage Type
FHA
Create a Home Valuation Report for This Property
The Home Valuation Report is an in-depth analysis detailing your home's value as well as a comparison with similar homes in the area
Home Values in the Area
Average Home Value in this Area
Purchase History
| Date | Buyer | Sale Price | Title Company |
|---|---|---|---|
| Shuta Benjamin | -- | Chicago Title Co Llc | |
| Jose | $235,000 | -- | |
| Rivera Jose L | -- | Chicago Title Co Llc |
Source: Public Records
Mortgage History
| Date | Status | Borrower | Loan Amount |
|---|---|---|---|
| Open | Shuta Benjamin | $280,330 | |
| Previous Owner | Rivera Jose L | $230,743 |
Source: Public Records
Tax History Compared to Growth
Tax History
| Year | Tax Paid | Tax Assessment Tax Assessment Total Assessment is a certain percentage of the fair market value that is determined by local assessors to be the total taxable value of land and additions on the property. | Land | Improvement |
|---|---|---|---|---|
| 2024 | $2,771 | $343,200 | $54,600 | $288,600 |
| 2023 | $2,685 | $326,900 | $51,100 | $275,800 |
| 2022 | $2,685 | $294,300 | $51,100 | $243,200 |
| 2021 | $2,507 | $254,700 | $51,100 | $203,600 |
| 2020 | $2,405 | $239,900 | $44,400 | $195,500 |
| 2019 | $2,254 | $221,700 | $44,400 | $177,300 |
| 2018 | $2,171 | $214,100 | $44,400 | $169,700 |
| 2017 | $2,080 | $210,700 | $44,400 | $166,300 |
| 2016 | $1,784 | $195,100 | $45,800 | $149,300 |
| 2014 | $1,526 | $201,100 | $51,000 | $150,100 |
| 2013 | -- | $189,000 | $50,900 | $138,100 |
Source: Public Records
Map
Nearby Homes
- 3359 Blue Jay Dr
- 3251 Mockingbird Ln
- 3353 Field Hawk Dr
- 501 Eagle Ct
- 48 E Division Rd
- 2054 Lawndale Dr
- 1954 Lawndale Dr
- 857 S Cedar Ln
- 0 Smoke Rd
- 1068 Linwood Ave
- 1556 Smoke Rd
- 28 South St
- 2 South St
- 3152 Heavilin Rd
- 1465 Clark Rd
- 2655 Vivante Dr
- 460 Locust St
- 1153 Horse Prairie Ave
- 456 Locust St
- 0 Silhavy Rd
- 1305 Meadow Glen Dr
- 1401 Meadow Glen Dr
- 1401 Meadowglen Dr
- 1303 Meadow Glen Dr
- 1303 Meadowglen Dr
- 1403 Meadow Glen Dr
- 1403 Meadowglen Dr
- 1301 Meadow Glen Dr
- 1301 Meadowglen Dr
- 1306 Meadowglen Dr
- 1306 Meadow Glen Dr
- 1402 Meadowglen Dr
- 1304 Meadowglen Dr
- 1304 Meadow Glen Dr
- 1405 Meadow Glen Dr
- 1405 Meadowglen Dr
- 1404 Meadowglen Dr
- 1207 Meadow Glen Dr
- 1207 Meadowglen Dr
- 1302 Meadow Glen Dr