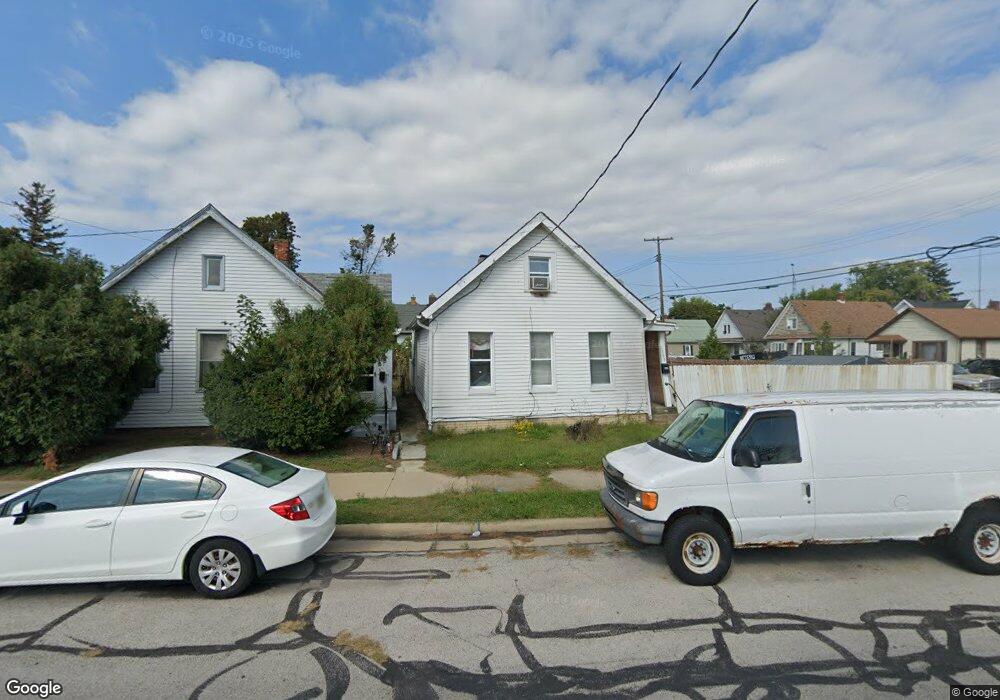
1305 N Depot St Sandusky, OH 44870
Estimated Value: $32,000 - $79,000
3
Beds
1
Bath
1,400
Sq Ft
$37/Sq Ft
Est. Value
About This Home
This home is located at 1305 N Depot St, Sandusky, OH 44870 and is currently estimated at $52,402, approximately $37 per square foot. 1305 N Depot St is a home located in Erie County with nearby schools including Sandusky High School, Monroe Preparatory Academy, and Sandusky Central Catholic School.
Ownership History
Date
Name
Owned For
Owner Type
Purchase Details
Closed on
Feb 18, 2025
Sold by
Faather Time Neteru and Faather Neteru
Bought by
Neteru Family Trust
Current Estimated Value
Purchase Details
Closed on
Feb 4, 2025
Sold by
Sparks Robert E and Sparks Mattie A
Bought by
Neteru Faather Time
Purchase Details
Closed on
Dec 30, 2020
Sold by
Sparks Robert and Sparks Mattie
Bought by
Faather Time Neteru
Home Financials for this Owner
Home Financials are based on the most recent Mortgage that was taken out on this home.
Original Mortgage
$30,000
Interest Rate
2.7%
Mortgage Type
New Conventional
Purchase Details
Closed on
Mar 8, 2017
Sold by
Sparks Robert and Sparks Mattie
Bought by
Winfield Robert and Winfield Lisa Marie
Purchase Details
Closed on
Jan 1, 1987
Bought by
Sparks Robert E and Sparks Mattie A
Create a Home Valuation Report for This Property
The Home Valuation Report is an in-depth analysis detailing your home's value as well as a comparison with similar homes in the area
Home Values in the Area
Average Home Value in this Area
Purchase History
| Date | Buyer | Sale Price | Title Company |
|---|---|---|---|
| Neteru Family Trust | -- | None Listed On Document | |
| Neteru Faather Time | $30,000 | None Listed On Document | |
| Faather Time Neteru | $30,000 | None Available | |
| Winfield Robert | $32,500 | None Available | |
| Sparks Robert E | -- | -- |
Source: Public Records
Mortgage History
| Date | Status | Borrower | Loan Amount |
|---|---|---|---|
| Previous Owner | Faather Time Neteru | $30,000 | |
| Closed | Winfield Robert | $0 |
Source: Public Records
Tax History Compared to Growth
Tax History
| Year | Tax Paid | Tax Assessment Tax Assessment Total Assessment is a certain percentage of the fair market value that is determined by local assessors to be the total taxable value of land and additions on the property. | Land | Improvement |
|---|---|---|---|---|
| 2024 | $691 | $17,541 | $1,599 | $15,942 |
| 2023 | $691 | $15,686 | $1,263 | $14,423 |
| 2022 | $815 | $15,686 | $1,263 | $14,423 |
| 2021 | $802 | $15,680 | $1,260 | $14,420 |
| 2020 | $727 | $13,060 | $1,260 | $11,800 |
| 2019 | $747 | $13,060 | $1,260 | $11,800 |
| 2018 | $748 | $13,060 | $1,260 | $11,800 |
| 2017 | $893 | $15,530 | $1,900 | $13,630 |
| 2016 | $892 | $15,530 | $1,900 | $13,630 |
| 2015 | $808 | $15,530 | $1,900 | $13,630 |
| 2014 | $803 | $15,530 | $1,900 | $13,630 |
| 2013 | $795 | $15,530 | $1,900 | $13,630 |
Source: Public Records
Map
Nearby Homes
- 1311 Filmore St
- 1413 Seneca St
- 1329 Carr St
- 1225 Polk St
- 1618 Mcdonough St
- 1417 Pierce St
- 1317 Stone St
- 1608 Pierce St
- 1813 Sandusky St
- 1204 W Monroe St
- 1514 Prospect St
- 717 W Osborne St
- 1725 Buchanan St
- 2028 W Forest Dr
- 912 Central Ave
- 1318 Mills St
- 621 Mcdonough St
- 1805 Mills St
- 1017 Putnam St
- 0 Brown