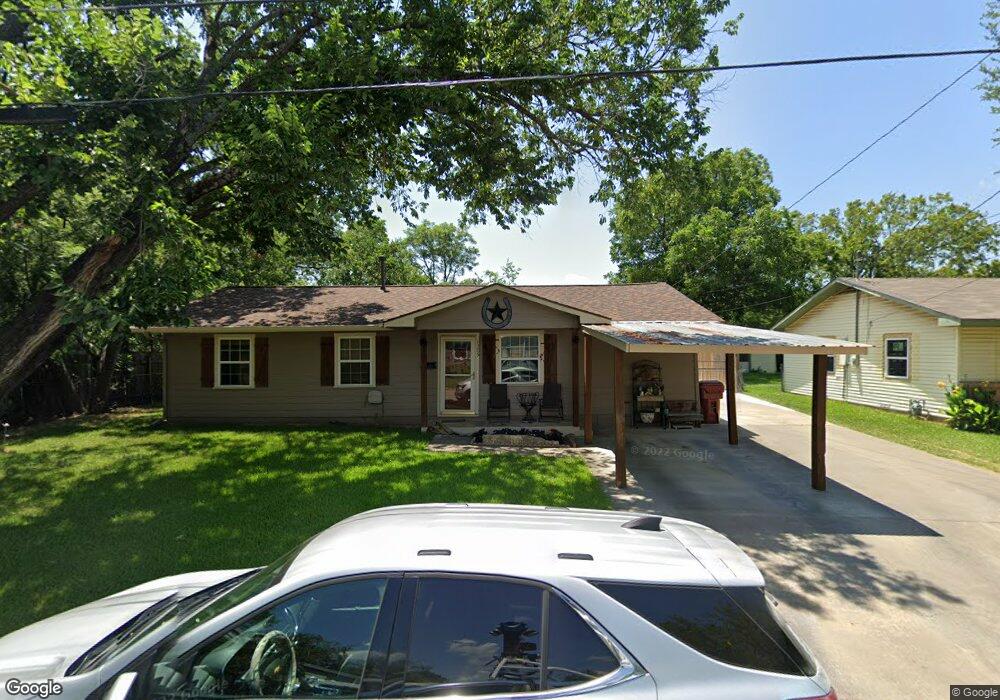
1305 Pine St Bonham, TX 75418
Estimated Value: $220,000 - $300,000
--
Bed
--
Bath
1,992
Sq Ft
$126/Sq Ft
Est. Value
About This Home
This home is located at 1305 Pine St, Bonham, TX 75418 and is currently estimated at $251,032, approximately $126 per square foot. 1305 Pine St is a home located in Fannin County with nearby schools including Finley-Oates Elementary School, LH Rather Jr High School, and Morning Star Academy.
Ownership History
Date
Name
Owned For
Owner Type
Purchase Details
Closed on
Jun 6, 2007
Sold by
Bankston Mike and Bankston Lou Ann
Bought by
Burtis John Austin and Burtis Susan Michelle
Current Estimated Value
Home Financials for this Owner
Home Financials are based on the most recent Mortgage that was taken out on this home.
Original Mortgage
$24,250
Outstanding Balance
$14,670
Interest Rate
6.16%
Mortgage Type
Purchase Money Mortgage
Estimated Equity
$236,362
Create a Home Valuation Report for This Property
The Home Valuation Report is an in-depth analysis detailing your home's value as well as a comparison with similar homes in the area
Home Values in the Area
Average Home Value in this Area
Purchase History
| Date | Buyer | Sale Price | Title Company |
|---|---|---|---|
| Burtis John Austin | -- | Cole Title Company |
Source: Public Records
Mortgage History
| Date | Status | Borrower | Loan Amount |
|---|---|---|---|
| Open | Burtis John Austin | $24,250 | |
| Closed | Burtis John Austin | $24,250 |
Source: Public Records
Tax History Compared to Growth
Tax History
| Year | Tax Paid | Tax Assessment Tax Assessment Total Assessment is a certain percentage of the fair market value that is determined by local assessors to be the total taxable value of land and additions on the property. | Land | Improvement |
|---|---|---|---|---|
| 2025 | $1,761 | $279,150 | $42,070 | $237,080 |
| 2024 | $1,761 | $240,200 | $40,230 | $199,970 |
| 2023 | $2,560 | $235,370 | $37,230 | $198,140 |
| 2022 | $2,596 | $220,260 | $26,210 | $194,050 |
| 2021 | $2,712 | $109,320 | $11,710 | $97,610 |
| 2020 | $2,493 | $101,590 | $8,780 | $92,810 |
| 2019 | $2,356 | $101,380 | $6,550 | $94,830 |
| 2018 | $2,139 | $80,610 | $6,460 | $74,150 |
| 2017 | $1,998 | $78,160 | $6,460 | $71,700 |
| 2016 | $1,981 | $77,490 | $6,460 | $71,030 |
| 2015 | -- | $75,730 | $6,290 | $69,440 |
| 2014 | -- | $75,360 | $6,200 | $69,160 |
Source: Public Records
Map
Nearby Homes