Estimated Value: $514,184 - $520,000
3
Beds
3
Baths
1,877
Sq Ft
$276/Sq Ft
Est. Value
About This Home
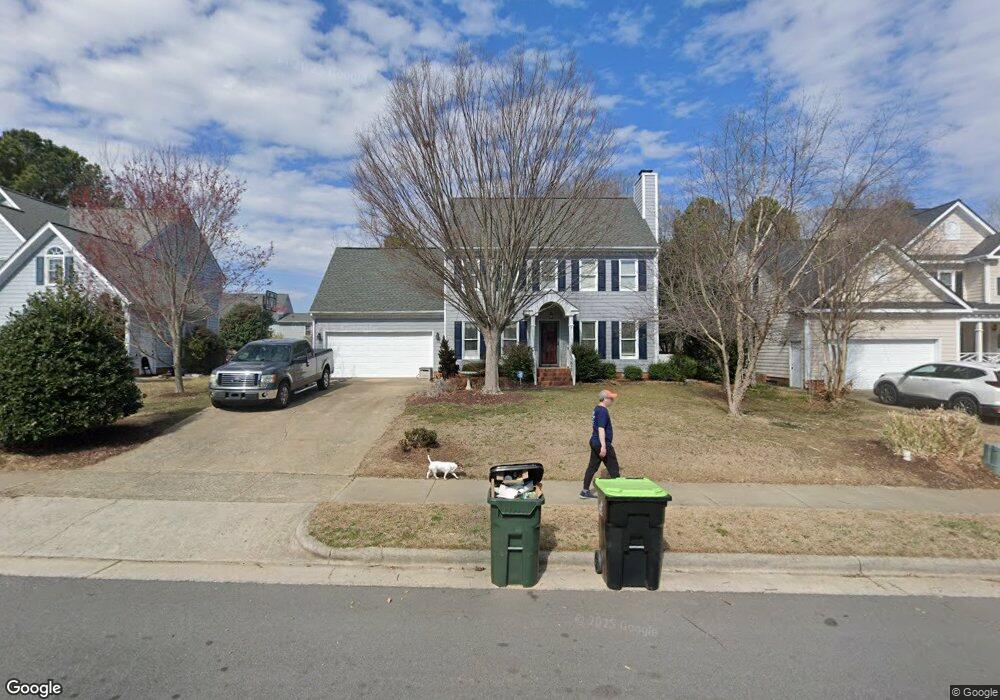
This home is located at 1305 Rainesview Ln, Apex, NC 27502 and is currently estimated at $517,546, approximately $275 per square foot. 1305 Rainesview Ln is a home located in Wake County with nearby schools including Apex Elementary School, Apex Middle, and Apex High School.
Ownership History
Date
Name
Owned For
Owner Type
Purchase Details
Closed on
May 24, 2012
Sold by
Burns Nancy L
Bought by
Kilby Joseph B and Kilby Jill A
Current Estimated Value
Home Financials for this Owner
Home Financials are based on the most recent Mortgage that was taken out on this home.
Original Mortgage
$190,000
Outstanding Balance
$131,703
Interest Rate
3.91%
Mortgage Type
New Conventional
Estimated Equity
$385,843
Purchase Details
Closed on
Dec 17, 2010
Sold by
Wood Nancy L and Burns Nancy L
Bought by
Burns Nancy L
Home Financials for this Owner
Home Financials are based on the most recent Mortgage that was taken out on this home.
Original Mortgage
$180,000
Interest Rate
3.87%
Mortgage Type
Adjustable Rate Mortgage/ARM
Create a Home Valuation Report for This Property
The Home Valuation Report is an in-depth analysis detailing your home's value as well as a comparison with similar homes in the area
Purchase History
| Date | Buyer | Sale Price | Title Company |
|---|---|---|---|
| Kilby Joseph B | $216,500 | None Available | |
| Burns Nancy L | -- | None Available |
Source: Public Records
Mortgage History
| Date | Status | Borrower | Loan Amount |
|---|---|---|---|
| Open | Kilby Joseph B | $190,000 | |
| Previous Owner | Burns Nancy L | $180,000 |
Source: Public Records
Tax History
| Year | Tax Paid | Tax Assessment Tax Assessment Total Assessment is a certain percentage of the fair market value that is determined by local assessors to be the total taxable value of land and additions on the property. | Land | Improvement |
|---|---|---|---|---|
| 2025 | $4,281 | $488,004 | $190,000 | $298,004 |
| 2024 | $4,185 | $488,004 | $190,000 | $298,004 |
Source: Public Records
Map
Nearby Homes
- 2361 Englemann Dr
- 2374 Englemann Dr
- 2350 Englemann Dr
- 2377 Englemann Dr
- 2357 Englemann Dr
- 2369 Englemann Dr
- 2373 Englemann Dr
- 2365 Englemann Dr
- 3123 June Lake Station
- 2354 Englemann Dr
- 2370 Englemann Dr
- 229 Old Grove Ln
- 124 Briarfield Dr
- 119 Heatherwood Dr
- 631 Sawcut Ln
- 635 Sawcut Ln
- 633 Sawcut Ln
- 327 Old Mill Village Dr
- 102 Briarcliff St
- 909 Bryn Mawr Ct
- 1303 Rainesview Ln
- 1307 Rainesview Ln
- 504 Vintage Grove Ln
- 1301 Rainesview Ln
- 1401 Rainesview Ln
- 502 Vintage Grove Ln
- 506 Vintage Grove Ln
- 500 Vintage Grove Ln
- 1306 Rainesview Ln
- 1304 Rainesview Ln
- 508 Vintage Grove Ln
- 1403 Rainesview Ln
- 1207 Rainesview Ln
- 1400 Rainesview Ln
- 1302 Rainesview Ln
- 503 Thorngate Rd
- 410 Vintage Grove Ln
- 1402 Rainesview Ln
- 1300 Rainesview Ln
- 1405 Rainesview Ln
Your Personal Tour Guide
Ask me questions while you tour the home.