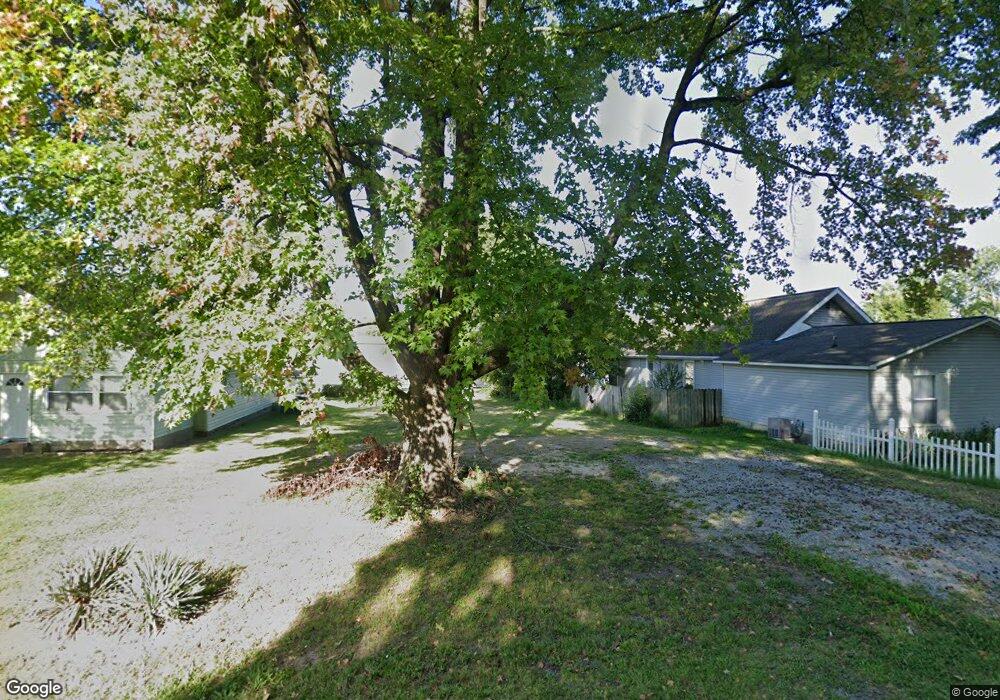
1305 S 13th St Herrin, IL 62948
Estimated Value: $64,000 - $135,000
3
Beds
--
Bath
1,064
Sq Ft
$87/Sq Ft
Est. Value
About This Home
This home is located at 1305 S 13th St, Herrin, IL 62948 and is currently estimated at $92,241, approximately $86 per square foot. 1305 S 13th St is a home located in Williamson County with nearby schools including North Side Primary Center, Herrin Community Elementary School, and Herrin Middle School.
Ownership History
Date
Name
Owned For
Owner Type
Purchase Details
Closed on
Nov 29, 2022
Sold by
Woolard Bobby E
Bought by
Hurricane Properties Llc
Current Estimated Value
Purchase Details
Closed on
Jun 24, 2022
Sold by
County Clerk Of The County Of Williamson
Bought by
P & N Properties Inc
Purchase Details
Closed on
Jun 17, 2022
Sold by
P & N Properties Inc
Bought by
Woolard Bobby E
Purchase Details
Closed on
Oct 5, 2017
Sold by
Harris Wendy L
Bought by
Nelson Paul V
Create a Home Valuation Report for This Property
The Home Valuation Report is an in-depth analysis detailing your home's value as well as a comparison with similar homes in the area
Home Values in the Area
Average Home Value in this Area
Purchase History
| Date | Buyer | Sale Price | Title Company |
|---|---|---|---|
| Hurricane Properties Llc | $15,000 | None Listed On Document | |
| P & N Properties Inc | -- | None Listed On Document | |
| Woolard Bobby E | $8,900 | None Listed On Document | |
| Nelson Paul V | $575,680 | -- |
Source: Public Records
Tax History
| Year | Tax Paid | Tax Assessment Tax Assessment Total Assessment is a certain percentage of the fair market value that is determined by local assessors to be the total taxable value of land and additions on the property. | Land | Improvement |
|---|---|---|---|---|
| 2025 | $330 | $3,800 | $3,800 | $0 |
| 2024 | $338 | $3,800 | $3,800 | $0 |
| 2023 | $330 | $3,800 | $3,800 | $0 |
| 2022 | $1,564 | $18,290 | $3,350 | $14,940 |
| 2021 | $1,521 | $17,630 | $3,230 | $14,400 |
| 2020 | $1,521 | $16,660 | $3,050 | $13,610 |
| 2019 | $1,416 | $16,660 | $3,050 | $13,610 |
| 2018 | $1,416 | $16,660 | $3,050 | $13,610 |
| 2017 | $1,384 | $16,660 | $3,050 | $13,610 |
| 2015 | $839 | $15,780 | $2,890 | $12,890 |
| 2013 | $644 | $15,780 | $2,890 | $12,890 |
| 2012 | $644 | $15,780 | $2,890 | $12,890 |
Source: Public Records
Map
Nearby Homes
Your Personal Tour Guide
Ask me questions while you tour the home.