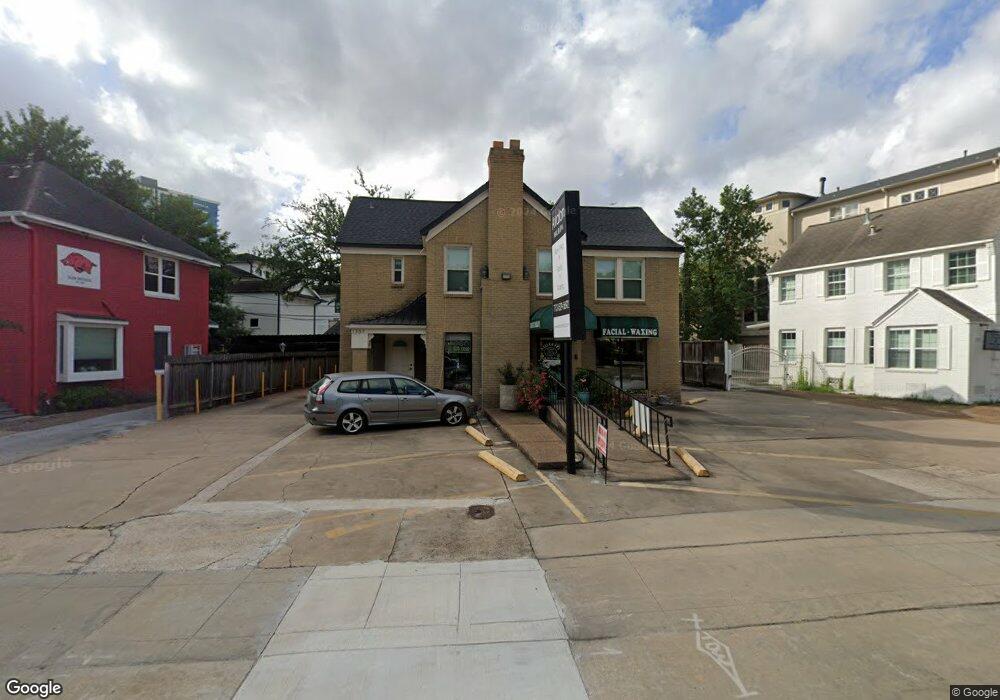
1305 S Shepherd Dr Houston, TX 77019
Montrose NeighborhoodEstimated Value: $828,000 - $1,525,000
--
Bed
--
Bath
2,542
Sq Ft
$419/Sq Ft
Est. Value
About This Home
This home is located at 1305 S Shepherd Dr, Houston, TX 77019 and is currently estimated at $1,065,982, approximately $419 per square foot. 1305 S Shepherd Dr is a home located in Harris County with nearby schools including Baker Montessori, Lanier Middle School, and Lamar High School.
Ownership History
Date
Name
Owned For
Owner Type
Purchase Details
Closed on
Aug 15, 2000
Sold by
Doby Christine Lynch
Bought by
Mederios Robert D and Huynh Thuy Hong
Current Estimated Value
Home Financials for this Owner
Home Financials are based on the most recent Mortgage that was taken out on this home.
Original Mortgage
$292,000
Interest Rate
8.22%
Purchase Details
Closed on
Feb 29, 1996
Sold by
Dirks Ida and Dirks Wayne D
Bought by
Doby Christine Lynch
Home Financials for this Owner
Home Financials are based on the most recent Mortgage that was taken out on this home.
Original Mortgage
$198,000
Interest Rate
7.01%
Purchase Details
Closed on
Feb 21, 1996
Sold by
Ida Dirks Associates Inc
Bought by
Dirks Wayne D and Dirks Ida
Home Financials for this Owner
Home Financials are based on the most recent Mortgage that was taken out on this home.
Original Mortgage
$198,000
Interest Rate
7.01%
Create a Home Valuation Report for This Property
The Home Valuation Report is an in-depth analysis detailing your home's value as well as a comparison with similar homes in the area
Home Values in the Area
Average Home Value in this Area
Purchase History
| Date | Buyer | Sale Price | Title Company |
|---|---|---|---|
| Mederios Robert D | -- | -- | |
| Doby Christine Lynch | -- | Heritage Title Co | |
| Dirks Wayne D | -- | Heritage Title Company |
Source: Public Records
Mortgage History
| Date | Status | Borrower | Loan Amount |
|---|---|---|---|
| Closed | Mederios Robert D | $292,000 | |
| Previous Owner | Doby Christine Lynch | $198,000 |
Source: Public Records
Tax History Compared to Growth
Tax History
| Year | Tax Paid | Tax Assessment Tax Assessment Total Assessment is a certain percentage of the fair market value that is determined by local assessors to be the total taxable value of land and additions on the property. | Land | Improvement |
|---|---|---|---|---|
| 2025 | $14,791 | $727,313 | $605,245 | $122,068 |
| 2024 | $14,791 | $706,925 | $605,245 | $101,680 |
| 2023 | $14,791 | $721,566 | $605,245 | $116,321 |
| 2022 | $15,424 | $700,501 | $605,245 | $95,256 |
| 2021 | $14,372 | $616,654 | $541,535 | $75,119 |
| 2020 | $14,763 | $609,660 | $541,535 | $68,125 |
| 2019 | $15,515 | $613,132 | $541,535 | $71,597 |
| 2018 | $15,355 | $606,794 | $541,535 | $65,259 |
| 2017 | $16,044 | $604,630 | $541,535 | $63,095 |
| 2016 | $14,358 | $604,798 | $541,535 | $63,263 |
| 2015 | $13,006 | $477,486 | $414,115 | $63,371 |
| 2014 | $13,006 | $482,493 | $420,486 | $62,007 |
Source: Public Records
Map
Nearby Homes
- 1216 S Shepherd Dr
- 2116 Looscan Ln
- 2117 Chilton Rd
- 1201 Mcduffie St Unit 198
- 1025 S Shepherd Dr Unit 209
- 2131 Brentwood Dr
- 1005 S Shepherd Dr Unit 406
- 1005 S Shepherd Dr Unit 304
- 2247 Chilton Rd
- 1601 S Shepherd Dr Unit 20
- 1601 S Shepherd Dr Unit 29
- 1601 S Shepherd Dr Unit 138
- 2105 Del Monte Dr
- 1509 Mcduffie St
- 2204 Inwood Dr
- 902 S Shepherd Dr
- 1606 Hazard St
- 1510 Morse St
- 1711 Huldy St Unit A
- 1712 Mcduffie St
- 1221 S Shepherd Dr
- 1309 S Shepherd Dr Unit 2
- 211 Pine Valley Dr
- 2062 Brentwood Dr
- 2082 Brentwood Dr
- 1219 S Shepherd Dr
- 2078 Brentwood Dr
- 2086 Brentwood Dr
- 2058 Brentwood Dr
- 2070 Brentwood Dr
- 2074 Brentwood Dr
- 2090 Brentwood Dr
- 1217 S Shepherd Dr
- 2054 Brentwood Dr
- 1300 S Shepherd Dr
- 1307 Denman Rd
- 1222 S Shepherd Dr
- 1307 Denman St
- 1211 S Shepherd Dr
- 2101 Pine Valley Dr