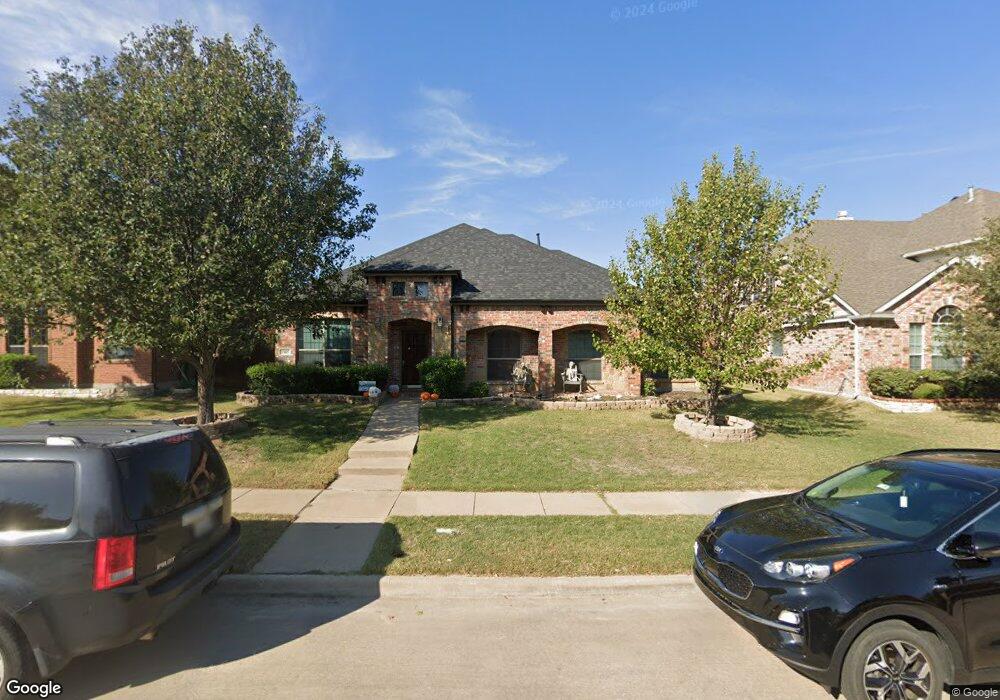
1305 Wheatberry Ln Allen, TX 75002
North East Allen NeighborhoodEstimated Value: $518,000 - $581,000
4
Beds
2
Baths
2,725
Sq Ft
$201/Sq Ft
Est. Value
About This Home
This home is located at 1305 Wheatberry Ln, Allen, TX 75002 and is currently estimated at $548,853, approximately $201 per square foot. 1305 Wheatberry Ln is a home located in Collin County with nearby schools including David & Lynda Olson Elementary School, Walter & Lois Curtis Middle School, and Lowery Freshman Center.
Ownership History
Date
Name
Owned For
Owner Type
Purchase Details
Closed on
Oct 23, 2018
Sold by
Burk Michelle Shannon and Burk Brad
Bought by
Gumpf Adam and Gumpf Amy
Current Estimated Value
Home Financials for this Owner
Home Financials are based on the most recent Mortgage that was taken out on this home.
Original Mortgage
$297,000
Outstanding Balance
$259,553
Interest Rate
4.6%
Mortgage Type
Purchase Money Mortgage
Estimated Equity
$289,300
Purchase Details
Closed on
Jul 22, 2013
Sold by
Bhat Robin and Bhat Paulomi
Bought by
Thompson Richard H and Thompson Marjorie L
Purchase Details
Closed on
Oct 6, 2006
Sold by
Standard Pacific Of Texas Lp
Bought by
Bhat Robin and Bhat Paulomi
Home Financials for this Owner
Home Financials are based on the most recent Mortgage that was taken out on this home.
Original Mortgage
$183,350
Interest Rate
6.44%
Mortgage Type
Purchase Money Mortgage
Create a Home Valuation Report for This Property
The Home Valuation Report is an in-depth analysis detailing your home's value as well as a comparison with similar homes in the area
Home Values in the Area
Average Home Value in this Area
Purchase History
| Date | Buyer | Sale Price | Title Company |
|---|---|---|---|
| Gumpf Adam | -- | Sendera Title | |
| Thompson Richard H | -- | Fatco | |
| Bhat Robin | -- | None Available |
Source: Public Records
Mortgage History
| Date | Status | Borrower | Loan Amount |
|---|---|---|---|
| Open | Gumpf Adam | $297,000 | |
| Previous Owner | Bhat Robin | $183,350 |
Source: Public Records
Tax History Compared to Growth
Tax History
| Year | Tax Paid | Tax Assessment Tax Assessment Total Assessment is a certain percentage of the fair market value that is determined by local assessors to be the total taxable value of land and additions on the property. | Land | Improvement |
|---|---|---|---|---|
| 2025 | $7,125 | $527,461 | $140,000 | $412,247 |
| 2024 | $7,125 | $479,510 | $140,000 | $430,966 |
| 2023 | $7,125 | $435,918 | $130,000 | $444,864 |
| 2022 | $7,867 | $396,289 | $115,000 | $354,396 |
| 2021 | $7,660 | $360,263 | $85,000 | $275,263 |
| 2020 | $7,595 | $344,570 | $85,000 | $259,570 |
| 2019 | $8,159 | $353,187 | $85,000 | $268,187 |
| 2018 | $7,999 | $340,097 | $80,000 | $260,097 |
| 2017 | $7,409 | $315,000 | $80,000 | $235,000 |
| 2016 | $7,127 | $313,150 | $65,000 | $248,150 |
| 2015 | $6,153 | $269,998 | $55,000 | $214,998 |
Source: Public Records
Map
Nearby Homes
- 1713 Whispering Glen Dr
- 1804 Goodnight Ln
- 1614 Wheatberry Ct
- 1026 Grand Teton Dr
- 1029 Grand Teton Dr
- 1011 Mesa Verde
- 1522 Farm Dale
- 907 Ozark Dr
- 1719 Live Oak Ln
- 1613 Country Brook Ln
- 1542 Home Park Dr
- 817 Rushmore Dr
- 1617 Live Oak Ln
- 1519 Silver Spur Dr
- 1540 Crystal Pass
- 1717 Monaco Dr
- 1552 Crystal Pass
- 1550 Charleston Dr
- 1404 Bradford Trace Dr
- 1526 Harvest Run Dr
- 1401 Wheatberry Ln
- 1303 Wheatberry Ln
- 1403 Wheatberry Ln
- 1301 Wheatberry Ln
- 1724 Country Bend
- 1717 Whispering Glen Dr
- 1306 Wheatberry Ln
- 1304 Wheatberry Ln
- 1402 Wheatberry Ln
- 1720 Country Bend
- 1715 Whispering Glen Dr
- 1302 Wheatberry Ln
- 1405 Wheatberry Ln
- 1404 Wheatberry Ln
- 1718 Country Bend
- 1300 Wheatberry Ln
- 1406 Wheatberry Ln
- 1722 Whispering Glen Dr
- 1720 Whispering Glen Dr
- 1724 Whispering Glen Dr