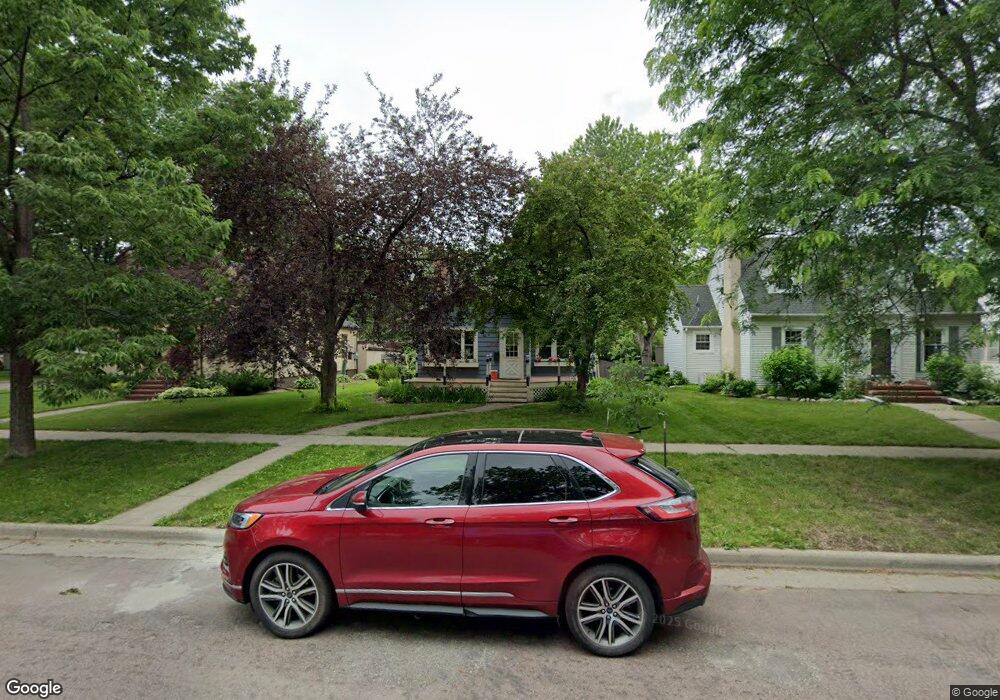
1306 4th St N Fargo, ND 58102
Horace Mann NeighborhoodEstimated Value: $287,000 - $368,000
4
Beds
2
Baths
1,802
Sq Ft
$174/Sq Ft
Est. Value
About This Home
This home is located at 1306 4th St N, Fargo, ND 58102 and is currently estimated at $313,727, approximately $174 per square foot. 1306 4th St N is a home located in Cass County with nearby schools including Horace Mann Roosevelt Elementary School, Ben Franklin Middle School, and North High School.
Ownership History
Date
Name
Owned For
Owner Type
Purchase Details
Closed on
Sep 28, 2015
Sold by
Porter Scott E and Porter Julie M
Bought by
Daueber Benjamin W and Daueber Jana Dee
Current Estimated Value
Home Financials for this Owner
Home Financials are based on the most recent Mortgage that was taken out on this home.
Original Mortgage
$176,610
Outstanding Balance
$69,076
Interest Rate
3.05%
Mortgage Type
New Conventional
Estimated Equity
$244,651
Create a Home Valuation Report for This Property
The Home Valuation Report is an in-depth analysis detailing your home's value as well as a comparison with similar homes in the area
Home Values in the Area
Average Home Value in this Area
Purchase History
| Date | Buyer | Sale Price | Title Company |
|---|---|---|---|
| Daueber Benjamin W | $192,900 | Title Co |
Source: Public Records
Mortgage History
| Date | Status | Borrower | Loan Amount |
|---|---|---|---|
| Open | Daueber Benjamin W | $176,610 |
Source: Public Records
Tax History Compared to Growth
Tax History
| Year | Tax Paid | Tax Assessment Tax Assessment Total Assessment is a certain percentage of the fair market value that is determined by local assessors to be the total taxable value of land and additions on the property. | Land | Improvement |
|---|---|---|---|---|
| 2024 | $3,256 | $127,950 | $22,300 | $105,650 |
| 2023 | $3,638 | $124,200 | $22,300 | $101,900 |
| 2022 | $3,626 | $121,750 | $22,300 | $99,450 |
| 2021 | $3,181 | $107,300 | $22,300 | $85,000 |
| 2020 | $3,000 | $101,850 | $22,300 | $79,550 |
| 2019 | $3,003 | $101,850 | $12,400 | $89,450 |
| 2018 | $2,597 | $87,600 | $12,400 | $75,200 |
| 2017 | $2,573 | $87,600 | $12,400 | $75,200 |
| 2016 | $2,386 | $87,600 | $12,400 | $75,200 |
| 2015 | $2,524 | $87,600 | $9,300 | $78,300 |
| 2014 | $2,316 | $77,350 | $9,300 | $68,050 |
| 2013 | $2,318 | $77,350 | $9,300 | $68,050 |
Source: Public Records
Map
Nearby Homes