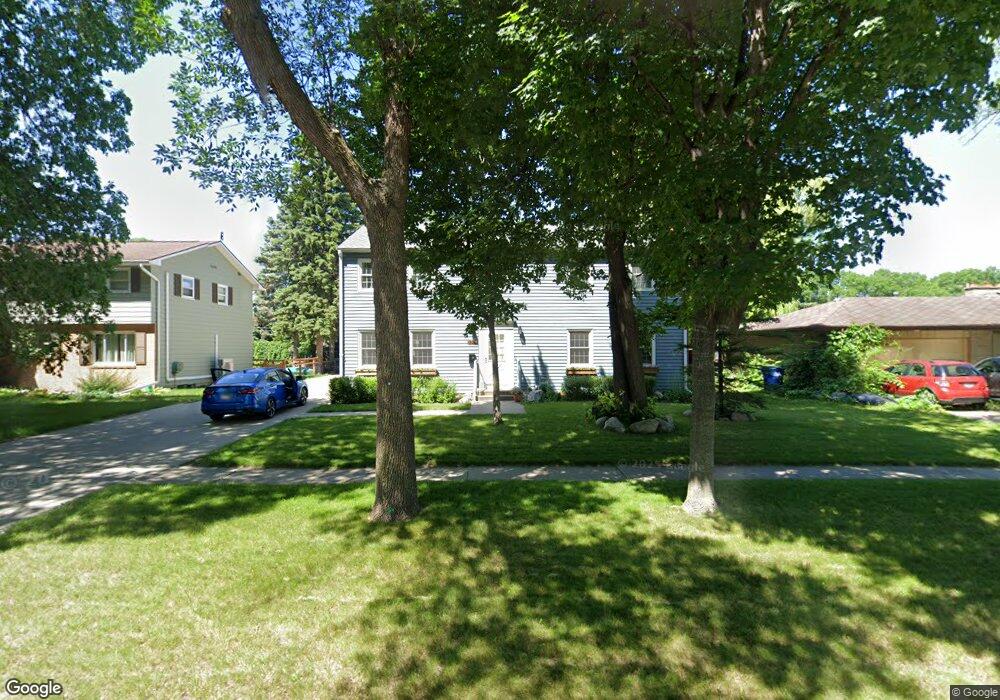
1306 Elm St N Fargo, ND 58102
Horace Mann NeighborhoodEstimated Value: $375,000 - $485,638
4
Beds
4
Baths
3,696
Sq Ft
$119/Sq Ft
Est. Value
About This Home
This home is located at 1306 Elm St N, Fargo, ND 58102 and is currently estimated at $439,910, approximately $119 per square foot. 1306 Elm St N is a home located in Cass County with nearby schools including Horace Mann Roosevelt Elementary School, Ben Franklin Middle School, and North High School.
Ownership History
Date
Name
Owned For
Owner Type
Purchase Details
Closed on
Feb 28, 2022
Sold by
Jean Berg
Bought by
Wayt Kathryn and Wayt Richard Joshua
Current Estimated Value
Home Financials for this Owner
Home Financials are based on the most recent Mortgage that was taken out on this home.
Original Mortgage
$288,000
Outstanding Balance
$267,938
Interest Rate
3.55%
Mortgage Type
New Conventional
Estimated Equity
$171,972
Create a Home Valuation Report for This Property
The Home Valuation Report is an in-depth analysis detailing your home's value as well as a comparison with similar homes in the area
Home Values in the Area
Average Home Value in this Area
Purchase History
| Date | Buyer | Sale Price | Title Company |
|---|---|---|---|
| Wayt Kathryn | -- | The Title Company | |
| Wayt Kathryn | $360,000 | The Title Company |
Source: Public Records
Mortgage History
| Date | Status | Borrower | Loan Amount |
|---|---|---|---|
| Open | Wayt Kathryn | $288,000 | |
| Closed | Wayt Kathryn | $288,000 |
Source: Public Records
Tax History Compared to Growth
Tax History
| Year | Tax Paid | Tax Assessment Tax Assessment Total Assessment is a certain percentage of the fair market value that is determined by local assessors to be the total taxable value of land and additions on the property. | Land | Improvement |
|---|---|---|---|---|
| 2024 | $5,601 | $221,800 | $35,250 | $186,550 |
| 2023 | $5,735 | $209,250 | $35,250 | $174,000 |
| 2022 | $5,086 | $181,950 | $35,250 | $146,700 |
| 2021 | $5,661 | $165,400 | $35,250 | $130,150 |
| 2020 | $5,390 | $162,150 | $35,250 | $126,900 |
| 2019 | $5,425 | $162,150 | $22,050 | $140,100 |
| 2018 | $4,822 | $139,900 | $22,050 | $117,850 |
| 2017 | $3,535 | $133,250 | $22,050 | $111,200 |
| 2016 | $3,046 | $124,550 | $22,050 | $102,500 |
| 2015 | $3,241 | $124,550 | $15,000 | $109,550 |
| 2014 | $3,170 | $118,700 | $15,000 | $103,700 |
| 2013 | $3,084 | $115,250 | $15,000 | $100,250 |
Source: Public Records
Map
Nearby Homes