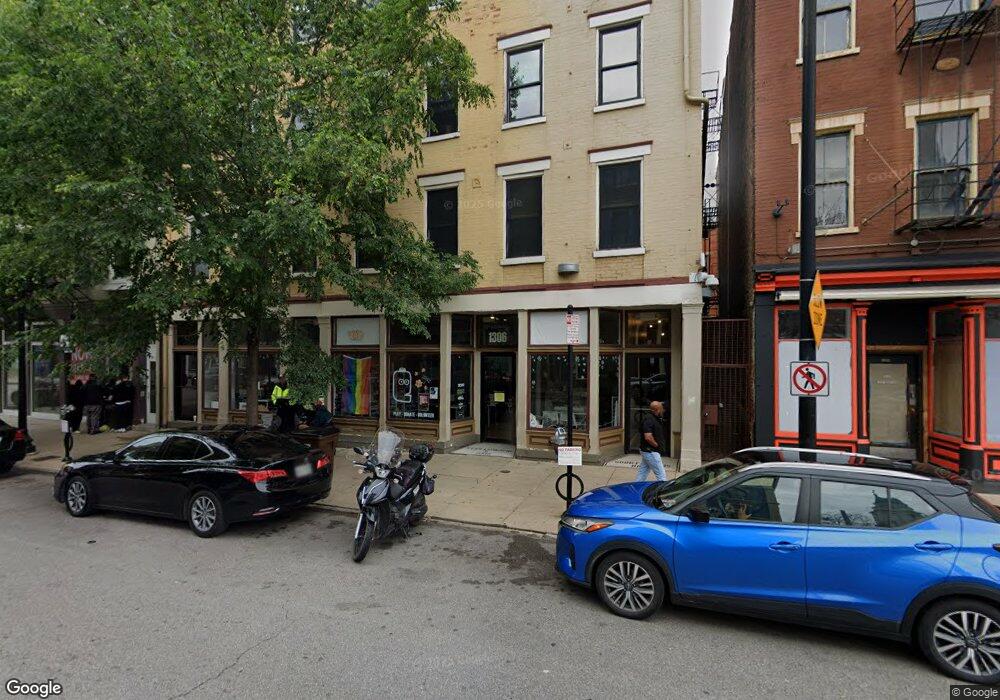
1306 Main St Cincinnati, OH 45202
Over-The-Rhine NeighborhoodEstimated Value: $319,000 - $337,000
1
Bed
2
Baths
1,081
Sq Ft
$304/Sq Ft
Est. Value
About This Home
This home is located at 1306 Main St, Cincinnati, OH 45202 and is currently estimated at $328,835, approximately $304 per square foot. 1306 Main St is a home located in Hamilton County with nearby schools including Rothenberg Preparatory Academy, Robert A. Taft Information Technology High School, and Gilbert A. Dater High School.
Ownership History
Date
Name
Owned For
Owner Type
Purchase Details
Closed on
Jul 22, 2021
Sold by
Weston Cathy H and The Cathy H Weston Revocable T
Bought by
Mansouri Borna
Current Estimated Value
Home Financials for this Owner
Home Financials are based on the most recent Mortgage that was taken out on this home.
Original Mortgage
$266,875
Outstanding Balance
$240,038
Interest Rate
2.9%
Mortgage Type
New Conventional
Estimated Equity
$88,797
Purchase Details
Closed on
Oct 24, 2013
Sold by
Rice Mike L
Bought by
Weston Cathy H and The Cathy H Weston Revocable Trust
Purchase Details
Closed on
Jan 8, 2009
Sold by
Urban Legacy Viii
Bought by
Rice Mike L
Home Financials for this Owner
Home Financials are based on the most recent Mortgage that was taken out on this home.
Original Mortgage
$192,600
Interest Rate
5.44%
Mortgage Type
New Conventional
Create a Home Valuation Report for This Property
The Home Valuation Report is an in-depth analysis detailing your home's value as well as a comparison with similar homes in the area
Home Values in the Area
Average Home Value in this Area
Purchase History
| Date | Buyer | Sale Price | Title Company |
|---|---|---|---|
| Mansouri Borna | $305,000 | First American Title | |
| Weston Cathy H | $201,500 | Attorney | |
| Rice Mike L | $214,000 | Attorney |
Source: Public Records
Mortgage History
| Date | Status | Borrower | Loan Amount |
|---|---|---|---|
| Open | Mansouri Borna | $266,875 | |
| Previous Owner | Rice Mike L | $192,600 |
Source: Public Records
Tax History
| Year | Tax Paid | Tax Assessment Tax Assessment Total Assessment is a certain percentage of the fair market value that is determined by local assessors to be the total taxable value of land and additions on the property. | Land | Improvement |
|---|---|---|---|---|
| 2025 | $6,509 | $101,710 | $17,500 | $84,210 |
| 2023 | $6,452 | $101,710 | $17,500 | $84,210 |
| 2022 | $5,787 | $81,459 | $19,152 | $62,307 |
| 2021 | $5,855 | $81,459 | $19,152 | $62,307 |
| 2020 | $5,871 | $81,459 | $19,152 | $62,307 |
| 2019 | $5,448 | $71,456 | $16,800 | $54,656 |
| 2018 | $1,833 | $71,456 | $16,800 | $54,656 |
| 2017 | $1,766 | $71,456 | $16,800 | $54,656 |
| 2016 | $1,366 | $70,525 | $11,424 | $59,101 |
| 2015 | $1,229 | $70,525 | $11,424 | $59,101 |
| 2014 | $4,783 | $70,525 | $11,424 | $59,101 |
| 2013 | $4,932 | $74,900 | $11,200 | $63,700 |
Source: Public Records
Map
Nearby Homes
- 1306 Main St
- 1306 Main St
- 1306 Main St
- 1306 Main St
- 1306 Main St Unit 5
- 1306 Main St Unit 4
- 1306 Main St Unit 3
- 1306 Main St Unit 2
- 1306 Main St Unit 1
- 1302 Main St Unit ID1056068P
- 1304 Main St
- 1301 Main St
- 1307 Main St
- 1309 Main St
- 1313 Main St
- 208 E 13th St
- 126 E 13th St Unit SI ID1056071P
- 126 E 13th St Unit SI ID1056025P
- 126 E 13th St Unit ID1056071P
- 126 E 13th St Unit ID1056025P
Your Personal Tour Guide
Ask me questions while you tour the home.