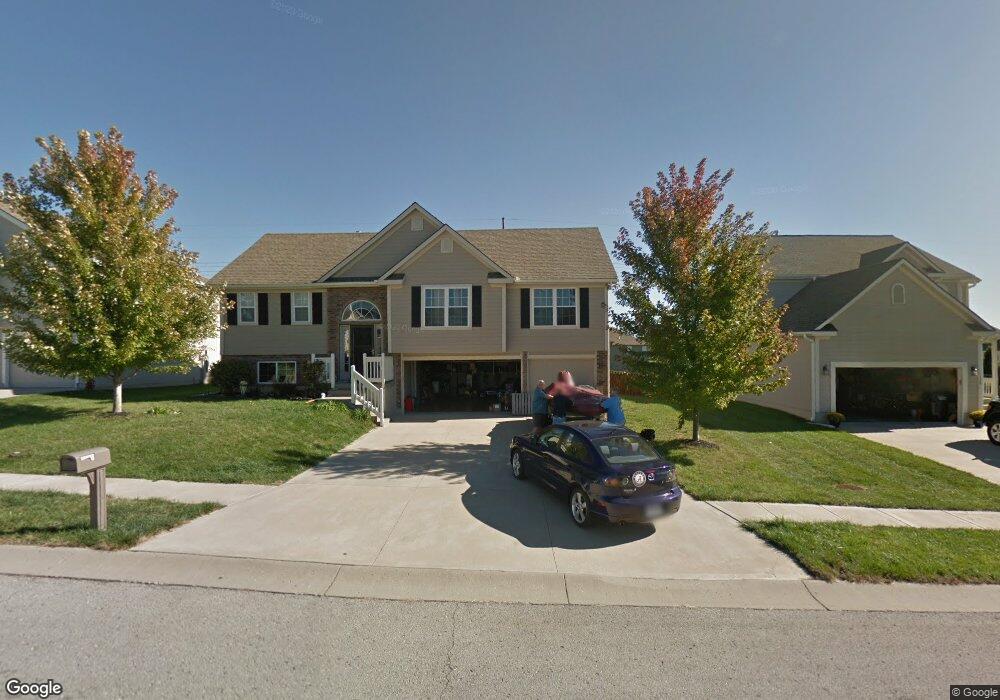
1306 NW Sycamore Dr Grain Valley, MO 64029
Estimated Value: $322,480 - $378,000
3
Beds
2
Baths
1,336
Sq Ft
$259/Sq Ft
Est. Value
About This Home
This home is located at 1306 NW Sycamore Dr, Grain Valley, MO 64029 and is currently estimated at $345,370, approximately $258 per square foot. 1306 NW Sycamore Dr is a home located in Jackson County with nearby schools including Grain Valley High School.
Ownership History
Date
Name
Owned For
Owner Type
Purchase Details
Closed on
Apr 6, 2017
Sold by
Brown Jon M and Brown Amanda R
Bought by
Mcgraw Denise
Current Estimated Value
Home Financials for this Owner
Home Financials are based on the most recent Mortgage that was taken out on this home.
Original Mortgage
$175,600
Outstanding Balance
$145,684
Interest Rate
4.1%
Mortgage Type
New Conventional
Estimated Equity
$199,686
Purchase Details
Closed on
Jun 24, 2005
Sold by
L A Case Construction Co Inc
Bought by
Brown Jon M and Brown Amanda R
Home Financials for this Owner
Home Financials are based on the most recent Mortgage that was taken out on this home.
Original Mortgage
$175,900
Interest Rate
5.76%
Mortgage Type
Fannie Mae Freddie Mac
Purchase Details
Closed on
Sep 10, 2004
Sold by
L & B Development Inc
Bought by
L A Case Construction Inc
Home Financials for this Owner
Home Financials are based on the most recent Mortgage that was taken out on this home.
Original Mortgage
$135,883
Interest Rate
5.95%
Mortgage Type
Construction
Create a Home Valuation Report for This Property
The Home Valuation Report is an in-depth analysis detailing your home's value as well as a comparison with similar homes in the area
Home Values in the Area
Average Home Value in this Area
Purchase History
| Date | Buyer | Sale Price | Title Company |
|---|---|---|---|
| Mcgraw Denise | $249,500 | Stewart Title Company | |
| Brown Jon M | -- | Stewart Title Of Kansas City | |
| L A Case Construction Inc | -- | Stewart Title Of Ks City Inc |
Source: Public Records
Mortgage History
| Date | Status | Borrower | Loan Amount |
|---|---|---|---|
| Open | Mcgraw Denise | $175,600 | |
| Previous Owner | Brown Jon M | $175,900 | |
| Previous Owner | L A Case Construction Inc | $135,883 |
Source: Public Records
Tax History Compared to Growth
Tax History
| Year | Tax Paid | Tax Assessment Tax Assessment Total Assessment is a certain percentage of the fair market value that is determined by local assessors to be the total taxable value of land and additions on the property. | Land | Improvement |
|---|---|---|---|---|
| 2025 | $4,094 | $44,225 | $9,126 | $35,099 |
| 2024 | $3,941 | $49,706 | $8,389 | $41,317 |
| 2023 | $3,941 | $49,706 | $8,962 | $40,744 |
| 2022 | $3,031 | $33,440 | $7,809 | $25,631 |
| 2021 | $2,960 | $33,440 | $7,809 | $25,631 |
| 2020 | $2,992 | $33,338 | $7,809 | $25,529 |
| 2019 | $2,931 | $33,338 | $7,809 | $25,529 |
| 2018 | $2,882 | $30,630 | $4,389 | $26,241 |
| 2017 | $2,882 | $30,630 | $4,389 | $26,241 |
| 2016 | $2,752 | $29,260 | $6,593 | $22,667 |
| 2014 | $2,962 | $31,255 | $5,715 | $25,540 |
Source: Public Records
Map
Nearby Homes
- 1310 NW Sycamore Dr
- 2003 NW Elmwood Dr
- 1103 NW Hickory Ct
- 2211 NW Hedgewood Dr
- 952 NW Maplewood Ct
- 1515 NW Whispering Ct
- 809 NW Poplar Ct
- 816 NW Cedar Ln
- 912 NW Hickorywood Dr
- 1702 NW Hedgewood Dr
- 408 NW Rust Ct
- 1800 NW Mya Ct
- 804 NW Hickory Ridge Dr
- 801 NW Hickory Ridge Dr
- 803 NW Hickory Ridge Dr
- 401 NW Europa Dr
- TBD E Duncan Rd
- 1601 NW Nicholas Dr
- 30911 E Pink Hill Rd
- 1403 NW Burr Oak Ct
- 1308 NW Sycamore Dr
- 1304 NW Sycamore Dr
- 2100 NW Sweetgum Ct
- 2103 NW Sweetgum Ct
- 1302 NW Sycamore Dr
- 1312 NW Sycamore Dr
- 1208 NW Persimmon Dr
- 2102 NW Sweetgum Ct
- 1300 NW Sycamore Dr
- 1401 NW Sycamore Dr
- 1302 NW Persimmon Dr
- 1206 NW Persimmon Dr
- 2104 NW Rosewood Dr
- 1314 NW Sycamore Dr
- 1300 NW Persimmon Dr
- 1304 NW Persimmon Dr
- 2107 NW Sweetgum Ct
- 2106 NW Rosewood Dr
- 1403 NW Sycamore Dr
- 1306 NW Persimmon Dr