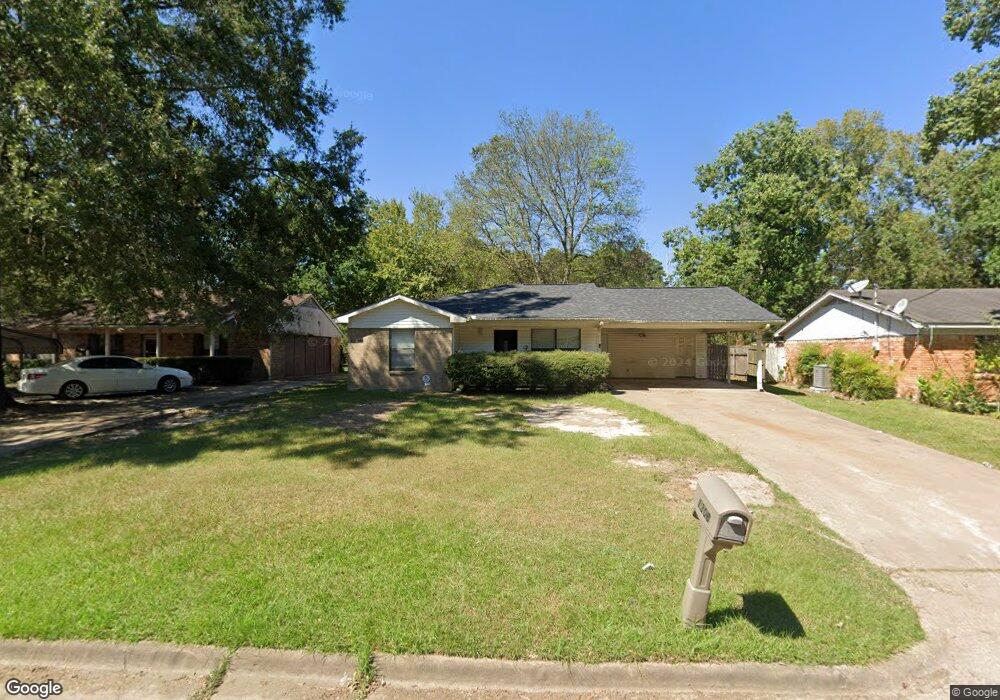
1306 Scott St Lufkin, TX 75904
Estimated Value: $133,993 - $174,000
Studio
8
Baths
1,332
Sq Ft
$115/Sq Ft
Est. Value
About This Home
This home is located at 1306 Scott St, Lufkin, TX 75904 and is currently estimated at $153,498, approximately $115 per square foot. 1306 Scott St is a home located in Angelina County with nearby schools including Trout Primary School, Brookhollow Elementary School, and Lufkin Middle School.
Ownership History
Date
Name
Owned For
Owner Type
Purchase Details
Closed on
Dec 6, 2024
Sold by
Morgan Janice
Bought by
Ccl Investment Series Llc
Current Estimated Value
Home Financials for this Owner
Home Financials are based on the most recent Mortgage that was taken out on this home.
Original Mortgage
$480,000
Outstanding Balance
$468,053
Interest Rate
6.54%
Mortgage Type
Seller Take Back
Estimated Equity
-$314,555
Purchase Details
Closed on
Sep 12, 2013
Sold by
Bullock Dean and Bullock Lucille
Bought by
Morgan Janice
Home Financials for this Owner
Home Financials are based on the most recent Mortgage that was taken out on this home.
Original Mortgage
$63,750
Interest Rate
4.41%
Mortgage Type
New Conventional
Purchase Details
Closed on
Sep 8, 2005
Sold by
Joiner Ima Jean
Bought by
Bullock Living Trust and Bullock Dean
Create a Home Valuation Report for This Property
The Home Valuation Report is an in-depth analysis detailing your home's value as well as a comparison with similar homes in the area
Purchase History
| Date | Buyer | Sale Price | Title Company |
|---|---|---|---|
| Ccl Investment Series Llc | -- | Security Guaranty Abstract | |
| Morgan Janice | $63,750 | Community Title | |
| Bullock Living Trust | -- | None Available |
Source: Public Records
Mortgage History
| Date | Status | Borrower | Loan Amount |
|---|---|---|---|
| Open | Ccl Investment Series Llc | $480,000 | |
| Previous Owner | Morgan Janice | $63,750 |
Source: Public Records
Tax History
| Year | Tax Paid | Tax Assessment Tax Assessment Total Assessment is a certain percentage of the fair market value that is determined by local assessors to be the total taxable value of land and additions on the property. | Land | Improvement |
|---|---|---|---|---|
| 2025 | $2,191 | $104,830 | $24,070 | $80,760 |
| 2024 | $2,033 | $97,260 | $24,070 | $73,190 |
| 2023 | $1,934 | $97,340 | $24,070 | $73,270 |
| 2022 | $2,062 | $90,510 | $9,530 | $80,980 |
| 2021 | $2,273 | $92,270 | $9,530 | $82,740 |
| 2020 | $2,114 | $86,020 | $9,530 | $76,490 |
| 2019 | $2,268 | $87,250 | $9,530 | $77,720 |
| 2018 | $1,949 | $85,700 | $9,530 | $76,170 |
| 2017 | $1,949 | $81,760 | $9,530 | $72,230 |
| 2016 | $1,812 | $76,010 | $5,770 | $70,240 |
| 2015 | $2,010 | $76,010 | $5,770 | $70,240 |
| 2014 | $2,010 | $77,410 | $5,770 | $71,640 |
Source: Public Records
Map
Nearby Homes
- 1435 Feagin Dr
- 1308 Southwood Dr
- 1008 Tom Temple Dr
- 1207 Southwood Dr
- 715 Pine Tree Ln
- 900 Wildbriar Dr
- 603 Morrow Ave
- 201 Mott Dr
- 911 Evans Dr
- 214 Brooks St
- 01 Lane Dr
- 915 Evans Dr
- 417 Vine Dr
- 409 Lynn Ave
- 420 Vine Dr
- R99018&139721 Loop 287
- 1370 Evans-Gann Rd
- 909 Covington Dr
- 404 Dogwood Trail
- 907 Southwood Dr
Your Personal Tour Guide
Ask me questions while you tour the home.