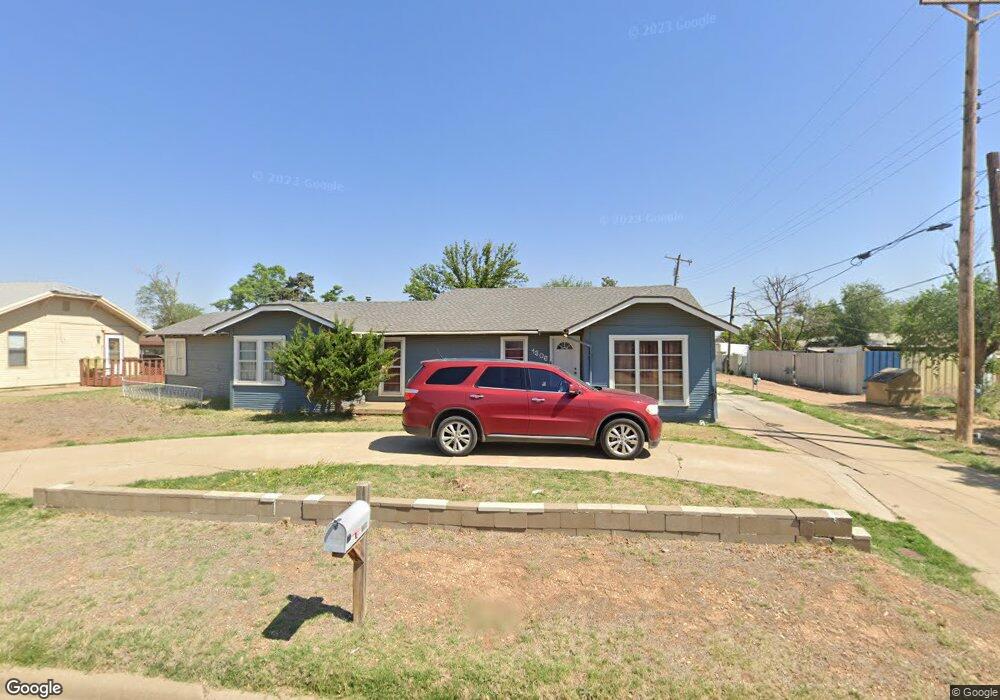
1306 W 8th St Plainview, TX 79072
Estimated Value: $117,000 - $158,624
3
Beds
2
Baths
1,760
Sq Ft
$74/Sq Ft
Est. Value
About This Home
This home is located at 1306 W 8th St, Plainview, TX 79072 and is currently estimated at $130,906, approximately $74 per square foot. 1306 W 8th St is a home located in Hale County with nearby schools including Highland Elementary School, College Hill Elementary School, and Coronado Middle School.
Ownership History
Date
Name
Owned For
Owner Type
Purchase Details
Closed on
Feb 9, 2021
Sold by
Moore Robert and Moore Emilia
Bought by
Jackson Hubert Terry and Jackson Robyn
Current Estimated Value
Home Financials for this Owner
Home Financials are based on the most recent Mortgage that was taken out on this home.
Original Mortgage
$64,800
Outstanding Balance
$57,856
Interest Rate
2.6%
Mortgage Type
New Conventional
Estimated Equity
$73,050
Purchase Details
Closed on
May 31, 2013
Sold by
Secretary Of Hud
Bought by
Moore Robert and Moore Emilia
Purchase Details
Closed on
Mar 26, 2008
Sold by
Dorman John A and Dorman Rochelle
Bought by
Rendon Pat and Rendon Shonda
Home Financials for this Owner
Home Financials are based on the most recent Mortgage that was taken out on this home.
Original Mortgage
$76,092
Interest Rate
5.72%
Mortgage Type
FHA
Create a Home Valuation Report for This Property
The Home Valuation Report is an in-depth analysis detailing your home's value as well as a comparison with similar homes in the area
Home Values in the Area
Average Home Value in this Area
Purchase History
| Date | Buyer | Sale Price | Title Company |
|---|---|---|---|
| Jackson Hubert Terry | -- | Old Republic Title | |
| Moore Robert | -- | None Available | |
| Rendon Pat | $76,092 | None Available |
Source: Public Records
Mortgage History
| Date | Status | Borrower | Loan Amount |
|---|---|---|---|
| Open | Jackson Hubert Terry | $64,800 | |
| Previous Owner | Rendon Pat | $76,092 |
Source: Public Records
Tax History Compared to Growth
Tax History
| Year | Tax Paid | Tax Assessment Tax Assessment Total Assessment is a certain percentage of the fair market value that is determined by local assessors to be the total taxable value of land and additions on the property. | Land | Improvement |
|---|---|---|---|---|
| 2024 | $2,496 | $89,416 | $4,185 | $85,231 |
| 2023 | $2,416 | $89,416 | $4,185 | $85,231 |
| 2022 | $2,205 | $78,438 | $4,185 | $74,253 |
| 2021 | $1,836 | $64,751 | $4,185 | $60,566 |
| 2020 | $1,624 | $64,092 | $4,185 | $59,907 |
| 2019 | $1,665 | $63,946 | $4,185 | $59,761 |
| 2018 | $1,537 | $63,946 | $4,185 | $59,761 |
| 2017 | $1,643 | $71,001 | $4,185 | $66,816 |
| 2016 | $1,540 | $71,001 | $4,185 | $66,816 |
| 2015 | -- | $68,818 | $4,185 | $64,633 |
| 2014 | -- | $67,862 | $4,185 | $63,677 |
Source: Public Records
Map
Nearby Homes
- 1410 W 8th St
- 1404 W 7th St
- 1004 Nassau St
- 1006 Nassau St
- 1105 W 11th St
- 602 Portland St
- 1512 W 11th St
- 1704 W 6th St
- 1214-1216 Oakland
- 808 W 11th St
- 906 W 12th St
- 711 Fresno St
- 1304 Kokomo St
- 1104 Galveston St
- 1205-1207 Raleigh St
- 1305 Smythe St
- 600 Vernon St
- 2203 W 12th St
- 612 Wayland St
- 2307 W 11th St
- 1310 W 8th St
- 801 Lexington St
- 803 Lexington St
- 808 Milwaukee St
- 805 Lexington St
- 714 Milwaukee St
- 807 Lexington St
- 713 Lexington St
- 809 Lexington St
- 710 Milwaukee St
- 812 Milwaukee St
- 801 Milwaukee St
- 709 Lexington St
- 805 Milwaukee St
- 811 Lexington St
- 807 Milwaukee St
- 715 Milwaukee St
- 708 Milwaukee St
- 809 Milwaukee St
- 1309 W 9th St