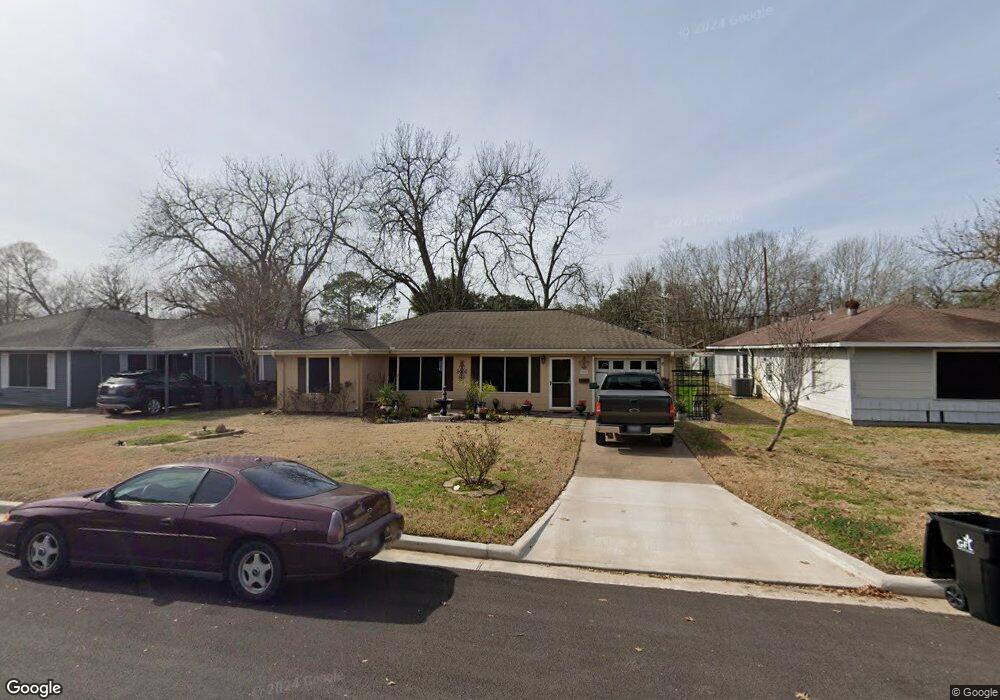
1306 Ward St Rosenberg, TX 77471
Estimated Value: $211,192 - $253,000
2
Beds
2
Baths
1,242
Sq Ft
$183/Sq Ft
Est. Value
About This Home
This home is located at 1306 Ward St, Rosenberg, TX 77471 and is currently estimated at $226,798, approximately $182 per square foot. 1306 Ward St is a home located in Fort Bend County with nearby schools including Travis Elementary School, Navarro Middle School, and George Junior High School.
Ownership History
Date
Name
Owned For
Owner Type
Purchase Details
Closed on
Jul 19, 2004
Sold by
Johnson Wilma Lois and Huddleston Willie Mae
Bought by
Lindemann Larry James
Current Estimated Value
Home Financials for this Owner
Home Financials are based on the most recent Mortgage that was taken out on this home.
Original Mortgage
$85,325
Outstanding Balance
$42,850
Interest Rate
6.3%
Mortgage Type
FHA
Estimated Equity
$183,948
Create a Home Valuation Report for This Property
The Home Valuation Report is an in-depth analysis detailing your home's value as well as a comparison with similar homes in the area
Home Values in the Area
Average Home Value in this Area
Purchase History
| Date | Buyer | Sale Price | Title Company |
|---|---|---|---|
| Lindemann Larry James | -- | First American Title |
Source: Public Records
Mortgage History
| Date | Status | Borrower | Loan Amount |
|---|---|---|---|
| Open | Lindemann Larry James | $85,325 |
Source: Public Records
Tax History Compared to Growth
Tax History
| Year | Tax Paid | Tax Assessment Tax Assessment Total Assessment is a certain percentage of the fair market value that is determined by local assessors to be the total taxable value of land and additions on the property. | Land | Improvement |
|---|---|---|---|---|
| 2025 | $2,474 | $179,000 | $65,527 | $113,473 |
| 2024 | $2,474 | $208,011 | $45,144 | $162,867 |
| 2023 | $2,206 | $189,101 | $10,625 | $178,476 |
| 2022 | $2,747 | $171,910 | $10,750 | $161,160 |
| 2021 | $3,243 | $156,280 | $46,320 | $109,960 |
| 2020 | $3,015 | $142,070 | $45,690 | $96,380 |
| 2019 | $2,950 | $129,150 | $27,740 | $101,410 |
| 2018 | $2,725 | $117,410 | $27,740 | $89,670 |
| 2017 | $2,491 | $106,740 | $27,740 | $79,000 |
| 2016 | $2,409 | $103,210 | $27,740 | $75,470 |
| 2015 | $1,937 | $102,630 | $27,740 | $74,890 |
| 2014 | $1,932 | $95,140 | $27,740 | $67,400 |
Source: Public Records
Map
Nearby Homes