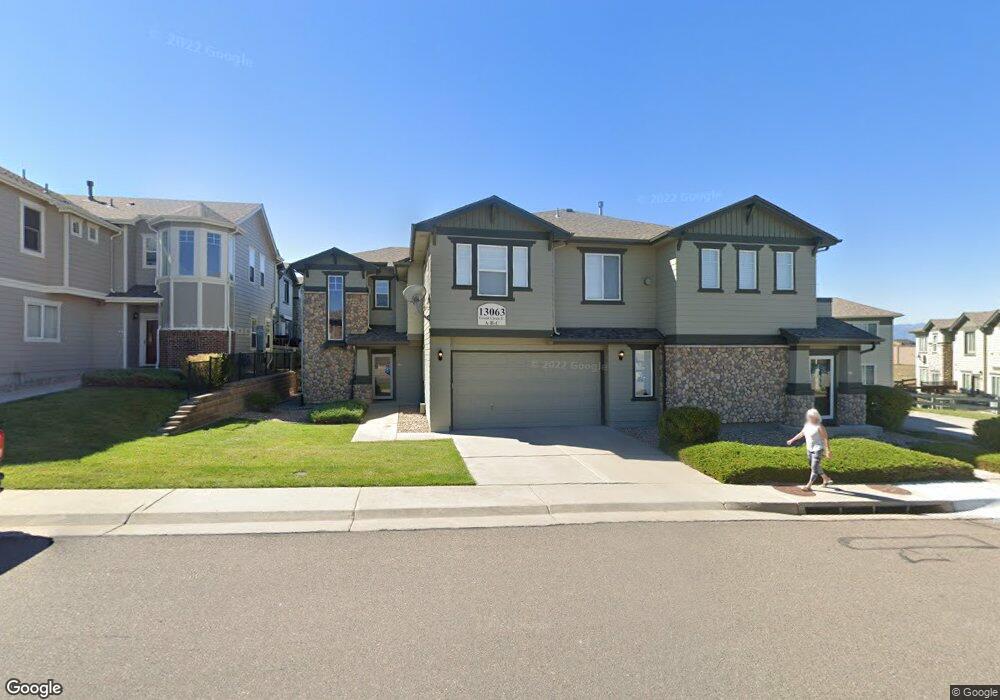
13063 Grant Cir E Unit B Thornton, CO 80241
Estimated Value: $410,617 - $426,000
3
Beds
3
Baths
1,328
Sq Ft
$314/Sq Ft
Est. Value
About This Home
This home is located at 13063 Grant Cir E Unit B, Thornton, CO 80241 and is currently estimated at $417,404, approximately $314 per square foot. 13063 Grant Cir E Unit B is a home located in Adams County with nearby schools including Hunters Glen Elementary School, Century Middle School, and Mountain Range High School.
Ownership History
Date
Name
Owned For
Owner Type
Purchase Details
Closed on
Jun 5, 2020
Sold by
Shaver Janet
Bought by
Prieto Jessica Lira and Prieto Yesenia Ira
Current Estimated Value
Home Financials for this Owner
Home Financials are based on the most recent Mortgage that was taken out on this home.
Original Mortgage
$313,310
Outstanding Balance
$277,725
Interest Rate
3.2%
Mortgage Type
New Conventional
Estimated Equity
$139,679
Purchase Details
Closed on
Mar 13, 2015
Sold by
Alscher Todd A and Palumbo Katrina M
Bought by
Shaver Janet
Home Financials for this Owner
Home Financials are based on the most recent Mortgage that was taken out on this home.
Original Mortgage
$164,800
Interest Rate
3.6%
Mortgage Type
New Conventional
Purchase Details
Closed on
Dec 22, 2006
Sold by
Ellgen Richard D and Ellgen Pamela D
Bought by
Alscher Todd A and Palumbo Katrina M
Create a Home Valuation Report for This Property
The Home Valuation Report is an in-depth analysis detailing your home's value as well as a comparison with similar homes in the area
Home Values in the Area
Average Home Value in this Area
Purchase History
| Date | Buyer | Sale Price | Title Company |
|---|---|---|---|
| Prieto Jessica Lira | $323,000 | First American | |
| Shaver Janet | $212,500 | First American Title | |
| Alscher Todd A | $189,950 | None Available |
Source: Public Records
Mortgage History
| Date | Status | Borrower | Loan Amount |
|---|---|---|---|
| Open | Prieto Jessica Lira | $313,310 | |
| Previous Owner | Shaver Janet | $164,800 |
Source: Public Records
Tax History Compared to Growth
Tax History
| Year | Tax Paid | Tax Assessment Tax Assessment Total Assessment is a certain percentage of the fair market value that is determined by local assessors to be the total taxable value of land and additions on the property. | Land | Improvement |
|---|---|---|---|---|
| 2024 | $2,466 | $24,630 | $5,000 | $19,630 |
| 2023 | $2,441 | $27,540 | $4,400 | $23,140 |
| 2022 | $2,420 | $21,970 | $4,240 | $17,730 |
| 2021 | $2,501 | $21,970 | $4,240 | $17,730 |
| 2020 | $2,435 | $21,830 | $4,360 | $17,470 |
| 2019 | $2,427 | $21,710 | $4,360 | $17,350 |
| 2018 | $2,094 | $18,200 | $1,160 | $17,040 |
| 2017 | $1,904 | $18,200 | $1,160 | $17,040 |
| 2016 | $1,489 | $13,860 | $1,280 | $12,580 |
| 2015 | $1,487 | $13,860 | $1,280 | $12,580 |
| 2014 | -- | $12,580 | $1,280 | $11,300 |
Source: Public Records
Map
Nearby Homes
- 13024 Grant Cir W Unit A
- 13043 Grant Cir E Unit C
- 12962 Grant Cir E Unit C
- 12921 Grant Cir W Unit B
- 13141 Grant Cir N Unit B
- 13151 Grant Cir N Unit B
- 13151 Grant Cir N Unit C
- 12910 Grant Cir W Unit C
- 12901 Grant Cir W Unit C
- 425 W 128th Dr
- 634 E 130th Way
- 609 W 130th Ave
- 0 128th & Washington St
- 13283 Clarkson St
- 12901 Galapago St
- 943 E 130th Dr
- 811 W 128th Place
- 1124 E 130th Ave Unit C
- 1089 E 131st Dr
- 834 W 128th Place
- 13063 Grant Cir E Unit C
- 13063 Grant Cir E Unit A
- 13063 Grant Cir E
- 13050 Grant Cir W Unit A
- 13050 Grant Cir W Unit C
- 13050 Grant Cir W Unit 61B
- 13040 Grant Cir W Unit C
- 13040 Grant Cir W Unit B
- 13040 Grant Cir W Unit A
- 13040 Grant Cir W
- 13093 Grant Cir N Unit B
- 13093 Grant Cir N Unit C
- 13093 Grant Cir N Unit A
- 13053 Grant Cir E Unit C
- 13053 Grant Cir E Unit B
- 13053 Grant Cir E Unit A
- 13053 Grant Cir E
- 13093 Grant Cir E Unit C
- 13028 Grant Cir W Unit C
- 13028 Grant Cir W Unit B