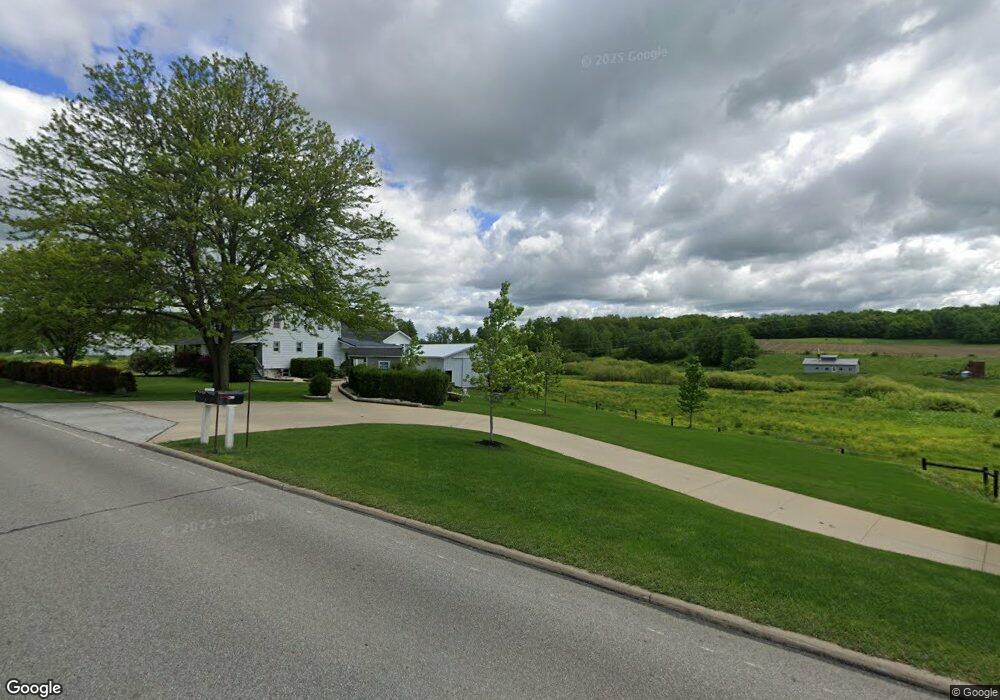
13067 Clay St Middlefield, OH 44062
Estimated Value: $732,000
3
Beds
1
Bath
2,882
Sq Ft
$254/Sq Ft
Est. Value
About This Home
This home is located at 13067 Clay St, Middlefield, OH 44062 and is currently estimated at $732,000, approximately $253 per square foot. 13067 Clay St is a home located in Geauga County with nearby schools including Jordak Elementary School, Cardinal Middle School, and Cardinal High School.
Ownership History
Date
Name
Owned For
Owner Type
Purchase Details
Closed on
Dec 9, 2024
Sold by
Yoder Joseph D and Yoder Emma J
Bought by
Yoder Joseph D and Yoder Emma J
Current Estimated Value
Purchase Details
Closed on
Mar 28, 2023
Sold by
Yoder Joseph D and Yoder Emma J
Bought by
Yoder Joseph D and Yoder Emma J
Purchase Details
Closed on
Jan 25, 2022
Sold by
Yoder Nancy R
Bought by
Yoder Joseph D
Purchase Details
Closed on
Mar 5, 2020
Sold by
Yoder Joseph D and Yoder Nancy R
Bought by
Yoder Joseph D and Yoder Nancy R
Purchase Details
Closed on
Nov 6, 2015
Sold by
Yoder Dan J and Yoder Emma J
Bought by
Yoder Dan J and Yoder Emma J
Purchase Details
Closed on
Mar 20, 2003
Sold by
Yoder Dan J and Yoder Emma J
Bought by
Kauffman Jake S and Kauffman Mary M
Purchase Details
Closed on
Jan 1, 1990
Bought by
Yoder Emma J and Yoder Dan J
Create a Home Valuation Report for This Property
The Home Valuation Report is an in-depth analysis detailing your home's value as well as a comparison with similar homes in the area
Home Values in the Area
Average Home Value in this Area
Purchase History
| Date | Buyer | Sale Price | Title Company |
|---|---|---|---|
| Yoder Joseph D | -- | None Listed On Document | |
| Yoder Joseph D | -- | None Listed On Document | |
| Bender Paul D | $51,900 | None Listed On Document | |
| Bender Paul D | $51,900 | None Listed On Document | |
| Yoder Joseph D | -- | None Listed On Document | |
| Miller Joseph C | -- | None Listed On Document | |
| Kauffman Joe S | -- | None Listed On Document | |
| Yoder Joseph D | -- | None Listed On Document | |
| Yoder Joseph D | -- | None Available | |
| Kauffman Jake S | $27,100 | None Available | |
| Yoder Dan J | -- | Attorney | |
| Kauffman Jake S | $7,000 | Western Reserve Title Co Ltd | |
| Yoder Emma J | -- | -- |
Source: Public Records
Tax History Compared to Growth
Tax History
| Year | Tax Paid | Tax Assessment Tax Assessment Total Assessment is a certain percentage of the fair market value that is determined by local assessors to be the total taxable value of land and additions on the property. | Land | Improvement |
|---|---|---|---|---|
| 2024 | $2,696 | $94,210 | $35,060 | $59,150 |
| 2023 | $2,696 | $97,720 | $38,570 | $59,150 |
| 2022 | $2,373 | $96,180 | $52,430 | $43,750 |
| 2021 | $2,220 | $96,180 | $52,430 | $43,750 |
| 2020 | $2,295 | $96,180 | $52,430 | $43,750 |
| 2019 | $2,568 | $93,350 | $55,970 | $37,380 |
| 2018 | $2,568 | $93,350 | $55,970 | $37,380 |
| 2017 | $2,568 | $93,350 | $55,970 | $37,380 |
| 2016 | $2,482 | $84,920 | $55,970 | $28,950 |
| 2015 | $2,286 | $84,920 | $55,970 | $28,950 |
| 2014 | $2,286 | $84,920 | $55,970 | $28,950 |
| 2013 | $1,494 | $84,920 | $55,970 | $28,950 |
Source: Public Records
Map
Nearby Homes
- 13105 Madison Rd
- 13689 Old State Rd
- 16270 Mayfield Rd
- 13137 Old State Rd
- 12342 Madison Rd
- 0 Old State Rd Unit 5157703
- 15575 Stillwell Rd
- 14686 Mayfield Rd
- 12175 Hunt Rd
- 16298 Weathervane Dr
- 14706 Steeplechase Dr
- 11470 Clay St
- 16008 Button St
- 13181 Claridon Troy Rd
- 16080 Chardon Windsor Rd
- 14753 Madison Rd
- VL Clay St
- 11976 Old State Rd
- 14452 Burton Windsor Rd
- 15410 High Pointe Cir